BSOD System_Service_Exception / DRIVER_IRQL_NOT_LESS_OR_EQUAL

Page 2 of 2 FirstFirst 12

  1. Posts : 11,269
    Windows 7 Home Premium 64 Bit
       #11

    Code:
    Microsoft (R) Windows Debugger Version 6.11.0001.404 AMD64
    Copyright (c) Microsoft Corporation. All rights reserved.
    
    
    Loading Dump File [D:\BSODDmpFiles\Tervel\012312-38859-01\012312-38859-01.dmp]
    Mini Kernel Dump File: Only registers and stack trace are available
    
    Symbol search path is: SRV*c:\symbols*http://msdl.microsoft.com/download/symbols
    Executable search path is: 
    Windows 7 Kernel Version 7601 (Service Pack 1) MP (4 procs) Free x64
    Product: WinNt, suite: TerminalServer SingleUserTS
    Built by: 7601.17640.amd64fre.win7sp1_gdr.110622-1506
    Machine Name:
    Kernel base = 0xfffff800`0320d000 PsLoadedModuleList = 0xfffff800`03452670
    Debug session time: Mon Jan 23 11:26:09.191 2012 (GMT-7)
    System Uptime: 0 days 7:09:32.846
    Loading Kernel Symbols
    ...............................................................
    ................................................................
    ..............................
    Loading User Symbols
    Loading unloaded module list
    ........
    *******************************************************************************
    *                                                                             *
    *                        Bugcheck Analysis                                    *
    *                                                                             *
    *******************************************************************************
    
    Use !analyze -v to get detailed debugging information.
    
    BugCheck C4, {1003, fffff98022c5efc8, fffff9803f130fc8, fffffa8005db90f0}
    
    Unable to load image VBoxDrv.sys, Win32 error 0n2
    *** WARNING: Unable to verify timestamp for VBoxDrv.sys
    *** ERROR: Module load completed but symbols could not be loaded for VBoxDrv.sys
    Probably caused by : VBoxDrv.sys ( VBoxDrv+19b3f )
    
    Followup: MachineOwner
    ---------
    
    3: kd> !analyze -v
    *******************************************************************************
    *                                                                             *
    *                        Bugcheck Analysis                                    *
    *                                                                             *
    *******************************************************************************
    
    DRIVER_VERIFIER_DETECTED_VIOLATION (c4)
    A device driver attempting to corrupt the system has been caught.  This is
    because the driver was specified in the registry as being suspect (by the
    administrator) and the kernel has enabled substantial checking of this driver.
    If the driver attempts to corrupt the system, bugchecks 0xC4, 0xC1 and 0xA will
    be among the most commonly seen crashes.
    Arguments:
    Arg1: 0000000000001003, Releasing two locks in reverse order of their acquire.
    Arg2: fffff98022c5efc8, First lock address.
    Arg3: fffff9803f130fc8, Second lock address.
    Arg4: fffffa8005db90f0, Verifier internal data.
    
    Debugging Details:
    ------------------
    
    
    BUGCHECK_STR:  0xc4_1003
    
    DRIVER_DEADLOCK: Deadlock detection not initialized 
    
    CUSTOMER_CRASH_COUNT:  1
    
    DEFAULT_BUCKET_ID:  VERIFIER_ENABLED_VISTA_MINIDUMP
    
    PROCESS_NAME:  VirtualBox.exe
    
    CURRENT_IRQL:  2
    
    LAST_CONTROL_TRANSFER:  from fffff800037133dc to fffff80003289c40
    
    STACK_TEXT:  
    fffff880`0a181558 fffff800`037133dc : 00000000`000000c4 00000000`00001003 fffff980`22c5efc8 fffff980`3f130fc8 : nt!KeBugCheckEx
    fffff880`0a181560 fffff800`037145c8 : fffff980`22c5efc8 fffff800`03714852 fffffa80`0366d6b0 00000000`00000003 : nt!VerifierBugCheckIfAppropriate+0x3c
    fffff880`0a1815a0 fffff800`03720817 : 00000000`0019357e fffff880`02e86b3f fffff800`03712290 fffff980`22c5efc8 : nt!ViDeadlockReportIssue+0x38
    fffff880`0a1815e0 fffff800`03721945 : fffff980`22c5efc8 00000000`00000001 00000000`00000000 fffff880`02e6e1ab : nt!VfDeadlockReleaseResource+0x257
    fffff880`0a1816a0 fffff880`02e86b3f : 00000000`00000001 00000000`00000000 fffffa80`07c96010 fffffa80`057619b0 : nt!VerifierExReleaseFastMutex+0x35
    fffff880`0a1816d0 00000000`00000001 : 00000000`00000000 fffffa80`07c96010 fffffa80`057619b0 fffff980`1f08e990 : VBoxDrv+0x19b3f
    fffff880`0a1816d8 00000000`00000000 : fffffa80`07c96010 fffffa80`057619b0 fffff980`1f08e990 fffff880`07f7415d : 0x1
    
    
    STACK_COMMAND:  kb
    
    FOLLOWUP_IP: 
    VBoxDrv+19b3f
    fffff880`02e86b3f ??              ???
    
    SYMBOL_STACK_INDEX:  5
    
    SYMBOL_NAME:  VBoxDrv+19b3f
    
    FOLLOWUP_NAME:  MachineOwner
    
    MODULE_NAME: VBoxDrv
    
    IMAGE_NAME:  VBoxDrv.sys
    
    DEBUG_FLR_IMAGE_TIMESTAMP:  4eef3189
    
    FAILURE_BUCKET_ID:  X64_0xc4_1003_VRF_VBoxDrv+19b3f
    
    BUCKET_ID:  X64_0xc4_1003_VRF_VBoxDrv+19b3f
    
    Followup: MachineOwner
    ---------
    It may be that the VirtualBox software is corrupted and needs to be re-installed. Uninstall the software, then install the latest version.

    If you continue to have problems, sometimes antivirus software can interfere with VirtualBox since it uses network resources. What antivirus do you use?
      My Computer


  2. Posts : 25
    Windows 7 x64
    Thread Starter
       #12

    Another BSOD, posting it in case it helps pinpoint anything.

    As for antivirus, I use Microsoft Security Essentials.
      My Computer


  3. Posts : 11,269
    Windows 7 Home Premium 64 Bit
       #13

    Code:
    
    Microsoft (R) Windows Debugger Version 6.11.0001.404 AMD64
    Copyright (c) Microsoft Corporation. All rights reserved.
    
    
    Loading Dump File [D:\BSODDmpFiles\Tervel\012412-35568-01\012412-35568-01.dmp]
    Mini Kernel Dump File: Only registers and stack trace are available
    
    Symbol search path is: SRV*c:\symbols*http://msdl.microsoft.com/download/symbols
    Executable search path is: 
    Windows 7 Kernel Version 7601 (Service Pack 1) MP (4 procs) Free x64
    Product: WinNt, suite: TerminalServer SingleUserTS
    Built by: 7601.17640.amd64fre.win7sp1_gdr.110622-1506
    Machine Name:
    Kernel base = 0xfffff800`03266000 PsLoadedModuleList = 0xfffff800`034ab670
    Debug session time: Mon Jan 23 16:09:00.932 2012 (GMT-7)
    System Uptime: 0 days 4:41:59.197
    Loading Kernel Symbols
    ...............................................................
    ................................................................
    ............................
    Loading User Symbols
    Loading unloaded module list
    .......
    *******************************************************************************
    *                                                                             *
    *                        Bugcheck Analysis                                    *
    *                                                                             *
    *******************************************************************************
    
    Use !analyze -v to get detailed debugging information.
    
    BugCheck 4E, {99, 923c4, 0, 2000000000da78c}
    
    Probably caused by : memory_corruption ( nt!MiBadShareCount+4c )
    
    Followup: MachineOwner
    ---------
    
    2: kd> !analyze -v
    *******************************************************************************
    *                                                                             *
    *                        Bugcheck Analysis                                    *
    *                                                                             *
    *******************************************************************************
    
    PFN_LIST_CORRUPT (4e)
    Typically caused by drivers passing bad memory descriptor lists (ie: calling
    MmUnlockPages twice with the same list, etc).  If a kernel debugger is
    available get the stack trace.
    Arguments:
    Arg1: 0000000000000099, A PTE or PFN is corrupt
    Arg2: 00000000000923c4, page frame number
    Arg3: 0000000000000000, current page state
    Arg4: 02000000000da78c, 0
    
    Debugging Details:
    ------------------
    
    
    BUGCHECK_STR:  0x4E_99
    
    CUSTOMER_CRASH_COUNT:  1
    
    DEFAULT_BUCKET_ID:  VERIFIER_ENABLED_VISTA_MINIDUMP
    
    PROCESS_NAME:  System
    
    CURRENT_IRQL:  2
    
    LAST_CONTROL_TRANSFER:  from fffff8000336bd7c to fffff800032e2c40
    
    STACK_TEXT:  
    fffff880`033fc988 fffff800`0336bd7c : 00000000`0000004e 00000000`00000099 00000000`000923c4 00000000`00000000 : nt!KeBugCheckEx
    fffff880`033fc990 fffff800`03292442 : ffffffff`ffffffff 00000000`00000001 ffffffff`ffffffff fffff800`032e5552 : nt!MiBadShareCount+0x4c
    fffff880`033fc9d0 fffff800`033e469a : fffff800`035185c0 fffff880`033fcbe0 00000000`00000000 fffff800`0000000f : nt! ?? ::FNODOBFM::`string'+0x21513
    fffff880`033fcbc0 fffff800`033e5c97 : fffffa80`0372a770 00000000`00000001 00000000`00000000 ffffffff`ffffffff : nt!MiEmptyWorkingSet+0x24a
    fffff880`033fcc70 fffff800`03783261 : 00000000`00000000 fffffa80`0372a770 00000000`00000080 00000000`00000080 : nt!MiTrimAllSystemPagableMemory+0x218
    fffff880`033fccd0 fffff800`037832d9 : fffffa80`0372a770 fffffa80`03687990 00000000`00000000 00000000`00000000 : nt!MmVerifierTrimMemory+0xf1
    fffff880`033fcd00 fffff800`0357dfee : 00000000`00000000 00000000`00000000 00000000`00000000 00000000`00000000 : nt!ViKeTrimWorkerThreadRoutine+0x29
    fffff880`033fcd40 fffff800`032d45e6 : fffff880`03164180 fffffa80`0372a770 fffff880`0316efc0 00000000`00000000 : nt!PspSystemThreadStartup+0x5a
    fffff880`033fcd80 00000000`00000000 : 00000000`00000000 00000000`00000000 00000000`00000000 00000000`00000000 : nt!KxStartSystemThread+0x16
    
    
    STACK_COMMAND:  kb
    
    FOLLOWUP_IP: 
    nt!MiBadShareCount+4c
    fffff800`0336bd7c cc              int     3
    
    SYMBOL_STACK_INDEX:  1
    
    SYMBOL_NAME:  nt!MiBadShareCount+4c
    
    FOLLOWUP_NAME:  MachineOwner
    
    MODULE_NAME: nt
    
    DEBUG_FLR_IMAGE_TIMESTAMP:  4e02aaa3
    
    IMAGE_NAME:  memory_corruption
    
    FAILURE_BUCKET_ID:  X64_0x4E_99_VRF_nt!MiBadShareCount+4c
    
    BUCKET_ID:  X64_0x4E_99_VRF_nt!MiBadShareCount+4c
    
    Followup: MachineOwner
    ---------
    Possible causes are Memory problems... Drivers...

    Your last two dumps were Verifier enabled; this means it is probably a good idea to either update VirtualBox or remove it at least for testing. Since the VirtualBox crash was not a VirtualBox network driver, I do not think it was related to MSE; MSE is trusted on these forums as not causing those types of crashes.

    This most recent crash did not give a driver as the cause. It may still be RAM related. What frequency does your RAM run at? AMD processors sometimes have difficulty with frequencies above 1333, especially if they are being overclocked, but even if not overclocking. Are you overclocking anything, by the way?
      My Computer


  4. Posts : 25
    Windows 7 x64
    Thread Starter
       #14

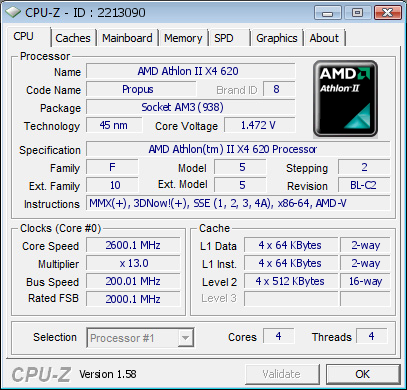
    Everything overclocking-related is set to default in BIOS - here's the frequencies and such according to CPU-Z:
    CPU-Z Validator 3.1
      My Computer


  5. Posts : 11,269
    Windows 7 Home Premium 64 Bit
       #15

    Oh, forgot your specs show that it is DDR2 RAM... Should be fine as long as it is compatible with the board. I'll have to look into that later.

    Edit: Do not see Corsair listed as being compatible with that board at 800, but that does not mean it is not, it just means Gigabyte never tested it. You would have to contact Corsair directly to find out if they believe those modules would work with your board and processor.
    Last edited by writhziden; 23 Jan 2012 at 19:29. Reason: RAM Compatibility
      My Computer


  6. Posts : 25
    Windows 7 x64
    Thread Starter
       #16

    I sent a support ticket in to Corsair to ask about the compatibility, but all I got in response was that they suggest I test the memory sticks one at a time - I don't think they quite got what I was asking.

    I've had two BSODs since my last post - attaching the minidumps.

    Is there any other diagnostic I can do? How can I reliably figure out what exactly is causing this if it's hardware related?
      My Computer


  7. Posts : 11,269
    Windows 7 Home Premium 64 Bit
       #17

    Hardware debugging is unfortunately not an exact science and is often difficult to debug with software tools. There are so many peripherals built into computers that it becomes cumbersome to narrow down general problems. The only method that really works reliably is swapping out components, testing things in another computer if possible (a friend's computer, for instance), and determining which parts work and which do not.

    That being said, there are tools for testing some aspects of the hardware. I see you are already familiar with prime95 and Furmark.


    Hardware Diags and PSU Testing are also good resources to check.


    Were you able to determine which hardware was causing your crashes?
    Last edited by writhziden; 18 Feb 2012 at 09:44. Reason: Which hardware?
      My Computer


Page 2 of 2 FirstFirst 12

  Related Discussions
Our Sites
Site Links
About Us
Windows 7 Forums is an independent web site and has not been authorized, sponsored, or otherwise approved by Microsoft Corporation. "Windows 7" and related materials are trademarks of Microsoft Corp.

© Designer Media Ltd
All times are GMT -5. The time now is 20:49.
Find Us