Intel(R) Advanced Network Services Virtual Adapter is failing here.
Code:
fffff880`0385a858  fffff880`07c42dabUnable to load image iansw60e.sys, Win32 error 0n2
*** WARNING: Unable to verify timestamp for iansw60e.sys
*** ERROR: Module load completed but symbols could not be loaded for iansw60e.sys
 iansw60e+0x6dab
Try to update it from http://www.intel.in/content/www/in/en/homepage.html or if possible, disable it.
Realtek PCIe GBE Family Controller is failing, too.
Code:
fffff880`0385a338  fffff880`07f6967cUnable to load image Rt64win7.sys, Win32 error 0n2
*** WARNING: Unable to verify timestamp for Rt64win7.sys
*** ERROR: Module load completed but symbols could not be loaded for Rt64win7.sys
 Rt64win7+0x1d67c
Update it from Realtek
But a BugCheck 9C is a hardware error. So it is do some hardware checks, too.
Test your RAM modules for possible errors.
How to Test and Diagnose RAM Issues with Memtest86+
Run memtest for at least 8 passes, preferably overnight.
Stress test the Graphics Card using Furmark.
Video Card - Stress Test with Furmark
Stress test the CPU.
Hardware - Stress Test With Prime95
Do some Disc checks.
- Update your SSD's Firmware
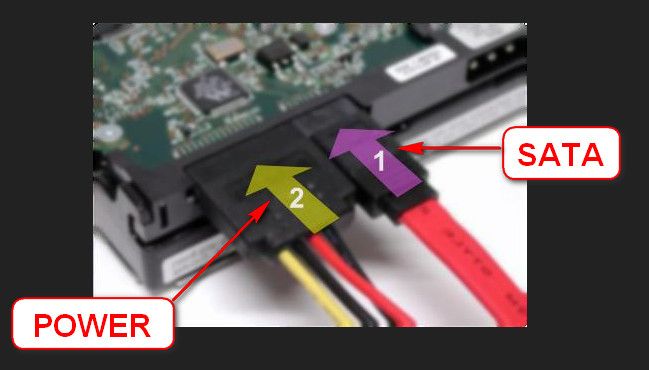
- Re-seat the sata and power.
- Run chkdsk /f/r, following the option two of the tutorial Disk Check
- Seatool for dos: SeaTools | Seagate download
Burn it in a blank cd. boot from the CD, click on "Accept", wait for it to finish detecting the drives, then in the upper left corner select "Basic Tests", then select "Long Test" and let it run.
Is the computer hot? Report us the heat of the computer after a couple of hours of your normal usage. Upload a screenshot of the summery tab of Speccy.
Let us know the results.
___________________________________________________________________________________
BSOD ANALYSIS:
Code:
.....
*******************************************************************************
*                                                                             *
*                        Bugcheck Analysis                                    *
*                                                                             *
*******************************************************************************

Use !analyze -v to get detailed debugging information.

BugCheck A, {e, 2, 1, fffff800032e05a9}

Probably caused by : win32k.sys ( win32k!RawInputThread+6ed )

Followup: MachineOwner
---------

10: kd> !analyze -v
*******************************************************************************
*                                                                             *
*                        Bugcheck Analysis                                    *
*                                                                             *
*******************************************************************************

IRQL_NOT_LESS_OR_EQUAL (a)
An attempt was made to access a pageable (or completely invalid) address at an
interrupt request level (IRQL) that is too high.  This is usually
caused by drivers using improper addresses.
If a kernel debugger is available get the stack backtrace.
Arguments:
Arg1: 000000000000000e, memory referenced
Arg2: 0000000000000002, IRQL
Arg3: 0000000000000001, bitfield :
    bit 0 : value 0 = read operation, 1 = write operation
    bit 3 : value 0 = not an execute operation, 1 = execute operation (only on chips which support this level of status)
Arg4: fffff800032e05a9, address which referenced memory

Debugging Details:
------------------


WRITE_ADDRESS: GetPointerFromAddress: unable to read from fffff80003511100
GetUlongFromAddress: unable to read from fffff800035111c0
 000000000000000e Nonpaged pool

CURRENT_IRQL:  2

FAULTING_IP:
nt!KiSearchForNewThread+1b9
fffff800`032e05a9 49895008        mov     qword ptr [r8+8],rdx

CUSTOMER_CRASH_COUNT:  1

DEFAULT_BUCKET_ID:  WIN7_DRIVER_FAULT

BUGCHECK_STR:  0xA

PROCESS_NAME:  csrss.exe

TRAP_FRAME:  fffff8800b774460 -- (.trap 0xfffff8800b774460)
NOTE: The trap frame does not contain all registers.
Some register values may be zeroed or incorrect.
rax=fffffa8038b4d980 rbx=0000000000000000 rcx=0000000000000009
rdx=fffffa8038b4d988 rsi=0000000000000000 rdi=0000000000000000
rip=fffff800032e05a9 rsp=fffff8800b7745f0 rbp=0000000000000001
 r8=0000000000000006  r9=0000000000000000 r10=0000000000000004
r11=fffffa8038b45ba0 r12=0000000000000000 r13=0000000000000000
r14=0000000000000000 r15=0000000000000000
iopl=0         nv up ei pl nz ac po nc
nt!KiSearchForNewThread+0x1b9:
fffff800`032e05a9 49895008        mov     qword ptr [r8+8],rdx ds:00000000`0000000e=????????????????
Resetting default scope

LAST_CONTROL_TRANSFER:  from fffff800032d91a9 to fffff800032d9c00

STACK_TEXT:
fffff880`0b774318 fffff800`032d91a9 : 00000000`0000000a 00000000`0000000e 00000000`00000002 00000000`00000001 : nt!KeBugCheckEx
fffff880`0b774320 fffff800`032d7e20 : 00000000`00000000 00000000`00000000 00000000`00000000 fffffa80`38b4d8e0 : nt!KiBugCheckDispatch+0x69
fffff880`0b774460 fffff800`032e05a9 : 00000000`0000000a 00000000`00000000 00000000`00000000 00000000`00000000 : nt!KiPageFault+0x260
fffff880`0b7745f0 fffff800`032cf5bc : 00000000`00000000 fffffa80`38b4d980 00000000`00000000 00000000`00000009 : nt!KiSearchForNewThread+0x1b9
fffff880`0b774660 fffff800`032dc0da : fffffa80`38b4d980 fffff800`032dcaf2 fffff880`00000000 fffffa80`38b1bb50 : nt!KiCommitThreadWait+0x17c
fffff880`0b7746f0 fffff960`000d56a9 : 00000000`00000004 fffffa80`388f2900 00000000`00000001 00000000`0000000d : nt!KeWaitForMultipleObjects+0x272
fffff880`0b7749b0 fffff960`000651b8 : fffffa80`0000007b 00000000`0000000f fffff880`00000001 ffffffff`80000338 : win32k!RawInputThread+0x6ed
fffff880`0b774a80 fffff960`000e629a : fffffa80`00000002 fffff880`0b759e00 00000000`00000020 00000000`00000000 : win32k!xxxCreateSystemThreads+0x58
fffff880`0b774ab0 fffff800`032d8e93 : fffffa80`38b4d980 00000000`00000004 000007ff`fffd3000 00000000`00000000 : win32k!NtUserCallNoParam+0x36
fffff880`0b774ae0 000007fe`fd681eea : 00000000`00000000 00000000`00000000 00000000`00000000 00000000`00000000 : nt!KiSystemServiceCopyEnd+0x13
00000000`000cfd28 00000000`00000000 : 00000000`00000000 00000000`00000000 00000000`00000000 00000000`00000000 : 0x000007fe`fd681eea


STACK_COMMAND:  kb

FOLLOWUP_IP:
win32k!RawInputThread+6ed
fffff960`000d56a9 8bf8            mov     edi,eax

SYMBOL_STACK_INDEX:  6

SYMBOL_NAME:  win32k!RawInputThread+6ed

FOLLOWUP_NAME:  MachineOwner

MODULE_NAME: win32k

IMAGE_NAME:  win32k.sys

DEBUG_FLR_IMAGE_TIMESTAMP:  5164dccb

FAILURE_BUCKET_ID:  X64_0xA_win32k!RawInputThread+6ed

BUCKET_ID:  X64_0xA_win32k!RawInputThread+6ed

Followup: MachineOwner
---------
Code:
.....
*******************************************************************************
*                                                                             *
*                        Bugcheck Analysis                                    *
*                                                                             *
*******************************************************************************

Use !analyze -v to get detailed debugging information.

BugCheck 9C, {0, fffff880009d7d70, 0, 0}

Probably caused by : Unknown_Image ( ANALYSIS_INCONCLUSIVE )

Followup: MachineOwner
---------

4: kd> !analyze -v
*******************************************************************************
*                                                                             *
*                        Bugcheck Analysis                                    *
*                                                                             *
*******************************************************************************

MACHINE_CHECK_EXCEPTION (9c)
A fatal Machine Check Exception has occurred.
KeBugCheckEx parameters;
    x86 Processors
        If the processor has ONLY MCE feature available (For example Intel
        Pentium), the parameters are:
        1 - Low  32 bits of P5_MC_TYPE MSR
        2 - Address of MCA_EXCEPTION structure
        3 - High 32 bits of P5_MC_ADDR MSR
        4 - Low  32 bits of P5_MC_ADDR MSR
        If the processor also has MCA feature available (For example Intel
        Pentium Pro), the parameters are:
        1 - Bank number
        2 - Address of MCA_EXCEPTION structure
        3 - High 32 bits of MCi_STATUS MSR for the MCA bank that had the error
        4 - Low  32 bits of MCi_STATUS MSR for the MCA bank that had the error
    IA64 Processors
        1 - Bugcheck Type
            1 - MCA_ASSERT
            2 - MCA_GET_STATEINFO
                SAL returned an error for SAL_GET_STATEINFO while processing MCA.
            3 - MCA_CLEAR_STATEINFO
                SAL returned an error for SAL_CLEAR_STATEINFO while processing MCA.
            4 - MCA_FATAL
                FW reported a fatal MCA.
            5 - MCA_NONFATAL
                SAL reported a recoverable MCA and we don't support currently
                support recovery or SAL generated an MCA and then couldn't
                produce an error record.
            0xB - INIT_ASSERT
            0xC - INIT_GET_STATEINFO
                  SAL returned an error for SAL_GET_STATEINFO while processing INIT event.
            0xD - INIT_CLEAR_STATEINFO
                  SAL returned an error for SAL_CLEAR_STATEINFO while processing INIT event.
            0xE - INIT_FATAL
                  Not used.
        2 - Address of log
        3 - Size of log
        4 - Error code in the case of x_GET_STATEINFO or x_CLEAR_STATEINFO
    AMD64 Processors
        1 - Bank number
        2 - Address of MCA_EXCEPTION structure
        3 - High 32 bits of MCi_STATUS MSR for the MCA bank that had the error
        4 - Low  32 bits of MCi_STATUS MSR for the MCA bank that had the error
Arguments:
Arg1: 0000000000000000
Arg2: fffff880009d7d70
Arg3: 0000000000000000
Arg4: 0000000000000000

Debugging Details:
------------------


BUGCHECK_STR:  0x9C_GenuineIntel

CUSTOMER_CRASH_COUNT:  1

DEFAULT_BUCKET_ID:  WIN7_DRIVER_FAULT

PROCESS_NAME:  System

CURRENT_IRQL:  f

LAST_CONTROL_TRANSFER:  from 0000000000000000 to fffff800032ddc00

STACK_TEXT:
fffff880`009d7d38 00000000`00000000 : 00000000`00000000 00000000`00000000 00000000`00000000 00000000`00000000 : nt!KeBugCheckEx


STACK_COMMAND:  kb

SYMBOL_NAME:  ANALYSIS_INCONCLUSIVE

FOLLOWUP_NAME:  MachineOwner

MODULE_NAME: Unknown_Module

IMAGE_NAME:  Unknown_Image

DEBUG_FLR_IMAGE_TIMESTAMP:  0

BUCKET_ID:  ZEROED_STACK

Followup: MachineOwner
---------


 Quote
Quote