BSOD even while sitting on Desktop after Fresh boot.


  1. Posts : 6
    Windows 7 Home Premium 64-bit
       #1

    BSOD even while sitting on Desktop after Fresh boot.


    I hope someone may be able to shed some light on the attached .dmp files.

    Not much experience with them and am starting to attempt to resolve or determine what may be happening to cause the BSOD
    Last edited by Pwnsesh; 09 Mar 2014 at 18:02. Reason: Requesting additional assistance
      My Computer


  2. Arc
    Posts : 35,373
    Microsoft Windows 10 Pro Insider Preview 64-bit
       #2

    Code:
    *******************************************************************************
    *                                                                             *
    *                        Bugcheck Analysis                                    *
    *                                                                             *
    *******************************************************************************
    
    Use !analyze -v to get detailed debugging information.
    
    BugCheck 1000007E, {ffffffffc0000005, fffff8800f420e26, fffff88002949568, fffff88002948dc0}
    
    Probably caused by : dxgmms1.sys ( dxgmms1!VIDMM_GLOBAL::ReferenceAllocationForPreparation+22 )
    
    Followup: MachineOwner
    ---------
    Such an issue will be hard to debug by analyzing the dump files only, and your SF Diag folder is empty. Re-run the SF Diag Tool and post it following the Blue Screen of Death (BSOD) Posting Instructions.
      My Computer


  3. Posts : 6
    Windows 7 Home Premium 64-bit
    Thread Starter
       #3

    Arc said:
    Code:
    *******************************************************************************
    *                                                                             *
    *                        Bugcheck Analysis                                    *
    *                                                                             *
    *******************************************************************************
    
    Use !analyze -v to get detailed debugging information.
    
    BugCheck 1000007E, {ffffffffc0000005, fffff8800f420e26, fffff88002949568, fffff88002948dc0}
    
    Probably caused by : dxgmms1.sys ( dxgmms1!VIDMM_GLOBAL::ReferenceAllocationForPreparation+22 )
    
    Followup: MachineOwner
    ---------
    Such an issue will be hard to debug by analyzing the dump files only, and your SF Diag folder is empty. Re-run the SF Diag Tool and post it following the Blue Screen of Death (BSOD) Posting Instructions.
    Thank you very much. I did update the SF file and hope it makes it a little easier to review.
      My Computer


  4. Arc
    Posts : 35,373
    Microsoft Windows 10 Pro Insider Preview 64-bit
       #4

    This particular issue is found in multiple crash dumps:
    Code:
    fffff880`04104b08  fffff880`01231f01*** WARNING: Unable to verify timestamp for iaStorA.sys
    *** ERROR: Module load completed but symbols could not be loaded for iaStorA.sys
     iaStorA+0x4f01
    Code:
    fffff880`02949358  fffff880`010ef001Unable to load image \SystemRoot\system32\drivers\iaStorV.sys, Win32 error 0n2
    *** WARNING: Unable to verify timestamp for iaStorV.sys
    *** ERROR: Module load completed but symbols could not be loaded for iaStorV.sys
     iaStorV+0x6c001
    These are Intel Rapid storage drivers. Always problematic. The best policy is to not use these drivers when those are failing. Update or anything will not give any permanent solution; and the driver is not old.
    Code:
    fffff880`0122d000 fffff880`014e7000   iaStorA  T (no symbols)           
        Loaded symbol image file: iaStorA.sys
        Image path: \SystemRoot\system32\DRIVERS\iaStorA.sys
        Image name: iaStorA.sys
        Timestamp:        Fri Aug 02 07:09:52 2013 (51FB0DE8)
        CheckSum:         000AC609
        ImageSize:        002BA000
        Translations:     0000.04b0 0000.04e4 0409.04b0 0409.04e4
    So you need to not use IRST, for good. For this purpose, you need to boot into the BIOS > Advanced mode. Disable RAID/SCSI/Intel Rapid Storage/Intel Smart Response etc anything is there. Set the storage controller to AHCI.

    But it will make the computer not bootable. So after disabling it, you will need to go for a clean reinstall.
      My Computer


  5. Posts : 6
    Windows 7 Home Premium 64-bit
    Thread Starter
       #5

    Arc said:
    This particular issue is found in multiple crash dumps:
    Code:
    fffff880`04104b08  fffff880`01231f01*** WARNING: Unable to verify timestamp for iaStorA.sys
    *** ERROR: Module load completed but symbols could not be loaded for iaStorA.sys
     iaStorA+0x4f01
    Code:
    fffff880`02949358  fffff880`010ef001Unable to load image \SystemRoot\system32\drivers\iaStorV.sys, Win32 error 0n2
    *** WARNING: Unable to verify timestamp for iaStorV.sys
    *** ERROR: Module load completed but symbols could not be loaded for iaStorV.sys
     iaStorV+0x6c001
    These are Intel Rapid storage drivers. Always problematic. The best policy is to not use these drivers when those are failing. Update or anything will not give any permanent solution; and the driver is not old.
    Code:
    fffff880`0122d000 fffff880`014e7000   iaStorA  T (no symbols)           
        Loaded symbol image file: iaStorA.sys
        Image path: \SystemRoot\system32\DRIVERS\iaStorA.sys
        Image name: iaStorA.sys
        Timestamp:        Fri Aug 02 07:09:52 2013 (51FB0DE8)
        CheckSum:         000AC609
        ImageSize:        002BA000
        Translations:     0000.04b0 0000.04e4 0409.04b0 0409.04e4
    So you need to not use IRST, for good. For this purpose, you need to boot into the BIOS > Advanced mode. Disable RAID/SCSI/Intel Rapid Storage/Intel Smart Response etc anything is there. Set the storage controller to AHCI.

    But it will make the computer not bootable. So after disabling it, you will need to go for a clean reinstall.
    I believe I was able to stop the use of IRST forgive me if I'm wrong I will have to investigate further if it's still there.

    Fresh Install and have yet to go an hour of using the new system without BSOD

    I hope the attached is of any use.
      My Computer


  6. Arc
    Posts : 35,373
    Microsoft Windows 10 Pro Insider Preview 64-bit
       #6

    Stress test the Graphics Card using Furmark.
    Video Card - Stress Test with Furmark
    Let us see a screenshot of the furmark window just before you close the window.

    Test your RAM modules for possible errors.
    How to Test and Diagnose RAM Issues with Memtest86+
    Run memtest for at least 8 passes, preferably overnight.
    If it start showing errors/red lines, stop testing. A single error is enough to determine that something is going bad there.

    Are you overclocking? As you are getting BSODs, you should stop overclocking and run all the hardware components like CPU, GPU and RAM to their default settings.

    Unfortunately I dont know any driver version that works good with GTX 770. You may try the drivers on a trial and error basis:

    • 320.49 WHQL
    • 327.23 WHQL
    • 331.58 WHWL
    • 331.65 WHQL
    • 331.82 WHQL

    Get them from Drivers - Download NVIDIA Drivers

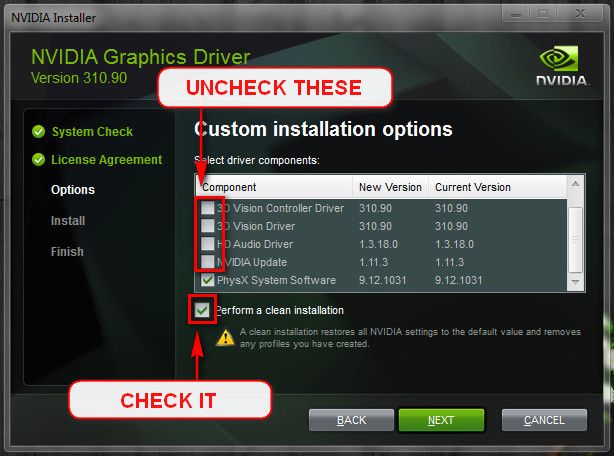
    Do a clean install on all of them. Uninstall the previously installed driver first.
    Uninstall All nvidia items in Control Panel > Programs and features

      • 3D Vision Control Driver
      • 3D Vision Driver
      • Graphics Driver
      • HD Audio Driver
      • PhysX
      • nvidia Update

      (Are you using nvidia chipset drivers? If so, dont uninstall anything other than those are listed).
    • Now follow Drivers - Clean Left over Files after Uninstalling
    • Download the target WHQL. While installing, Select Custom (Advanced) install. In the next page, follow this settings:


    Lengthy process, but the only stable version of nvidia is 314.22 lately, which does not support 700 series GPUs.
    __________________________________________________________________________________________
    Code:
    *******************************************************************************
    *                                                                             *
    *                        Bugcheck Analysis                                    *
    *                                                                             *
    *******************************************************************************
    
    Use !analyze -v to get detailed debugging information.
    
    BugCheck 1000007E, {ffffffffc0000005, fffff8800f0326be, fffff88009957408, fffff88009956c60}
    
    Probably caused by : dxgmms1.sys ( dxgmms1!VIDMM_SEGMENT::TrimAllProcesses+14e )
    
    Followup: MachineOwner
    ---------
    
    0: kd> !analyze -v
    *******************************************************************************
    *                                                                             *
    *                        Bugcheck Analysis                                    *
    *                                                                             *
    *******************************************************************************
    
    SYSTEM_THREAD_EXCEPTION_NOT_HANDLED_M (1000007e)
    This is a very common bugcheck.  Usually the exception address pinpoints
    the driver/function that caused the problem.  Always note this address
    as well as the link date of the driver/image that contains this address.
    Some common problems are exception code 0x80000003.  This means a hard
    coded breakpoint or assertion was hit, but this system was booted
    /NODEBUG.  This is not supposed to happen as developers should never have
    hardcoded breakpoints in retail code, but ...
    If this happens, make sure a debugger gets connected, and the
    system is booted /DEBUG.  This will let us see why this breakpoint is
    happening.
    Arguments:
    Arg1: ffffffffc0000005, The exception code that was not handled
    Arg2: fffff8800f0326be, The address that the exception occurred at
    Arg3: fffff88009957408, Exception Record Address
    Arg4: fffff88009956c60, Context Record Address
    
    Debugging Details:
    ------------------
    
    
    EXCEPTION_CODE: (NTSTATUS) 0xc0000005 - The instruction at 0x%08lx referenced memory at 0x%08lx. The memory could not be %s.
    
    FAULTING_IP: 
    dxgmms1!VIDMM_SEGMENT::TrimAllProcesses+14e
    fffff880`0f0326be 48398d90000000  cmp     qword ptr [rbp+90h],rcx
    
    EXCEPTION_RECORD:  fffff88009957408 -- (.exr 0xfffff88009957408)
    ExceptionAddress: fffff8800f0326be (dxgmms1!VIDMM_SEGMENT::TrimAllProcesses+0x000000000000014e)
       ExceptionCode: c0000005 (Access violation)
      ExceptionFlags: 00000000
    NumberParameters: 2
       Parameter[0]: 0000000000000000
       Parameter[1]: 0000000000001090
    Attempt to read from address 0000000000001090
    
    CONTEXT:  fffff88009956c60 -- (.cxr 0xfffff88009956c60)
    rax=fffffa800e37c000 rbx=000000000000000c rcx=00000000000a1480
    rdx=0000000000000000 rsi=0000000000000000 rdi=fffff8a00722fa70
    rip=fffff8800f0326be rsp=fffff88009957640 rbp=0000000000001000
     r8=0000000000000000  r9=0000000000000000 r10=fffffa800e38cec0
    r11=fffff8a003455f80 r12=fffffa800e38cec0 r13=0000000000000000
    r14=fffff8a0072405e0 r15=fffff8a00722fa98
    iopl=0         nv up ei pl nz na pe nc
    cs=0010  ss=0018  ds=002b  es=002b  fs=0053  gs=002b             efl=00010202
    dxgmms1!VIDMM_SEGMENT::TrimAllProcesses+0x14e:
    fffff880`0f0326be 48398d90000000  cmp     qword ptr [rbp+90h],rcx ss:0018:00000000`00001090=????????????????
    Resetting default scope
    
    CUSTOMER_CRASH_COUNT:  1
    
    DEFAULT_BUCKET_ID:  WIN7_DRIVER_FAULT
    
    PROCESS_NAME:  csrss.exe
    
    CURRENT_IRQL:  0
    
    ERROR_CODE: (NTSTATUS) 0xc0000005 - The instruction at 0x%08lx referenced memory at 0x%08lx. The memory could not be %s.
    
    EXCEPTION_PARAMETER1:  0000000000000000
    
    EXCEPTION_PARAMETER2:  0000000000001090
    
    READ_ADDRESS: GetPointerFromAddress: unable to read from fffff80002cc1100
    GetUlongFromAddress: unable to read from fffff80002cc11c0
     0000000000001090 Nonpaged pool
    
    FOLLOWUP_IP: 
    dxgmms1!VIDMM_SEGMENT::TrimAllProcesses+14e
    fffff880`0f0326be 48398d90000000  cmp     qword ptr [rbp+90h],rcx
    
    BUGCHECK_STR:  0x7E
    
    LAST_CONTROL_TRANSFER:  from fffff8800f0241dd to fffff8800f0326be
    
    STACK_TEXT:  
    fffff880`09957640 fffff880`0f0241dd : fffffa80`0e38cec0 fffff880`0000000c 00000000`00000000 fffff880`0f26ac7e : dxgmms1!VIDMM_SEGMENT::TrimAllProcesses+0x14e
    fffff880`09957710 fffff880`0f01fba3 : fffff8a0`0352de50 fffff8a0`0352de50 fffffa80`0e37c000 fffffa80`0d045170 : dxgmms1!VIDMM_GLOBAL::AllocateResourceForPinnedAllocation+0x55
    fffff880`09957790 fffff880`0f01f4b3 : fffff880`09957ae8 00000000`00000004 fffff880`09957a60 fffff880`09957af8 : dxgmms1!VIDMM_GLOBAL::ProcessDeferredCommand+0x19f
    fffff880`099578b0 fffff880`0f0393ad : 00000000`07140000 fffffa80`0f12a710 fffffa80`0e371d50 fffffa80`0e371c08 : dxgmms1!VidMmiProcessSystemCommand+0x23
    fffff880`099578e0 fffff880`0f038538 : fffff880`09957a40 00000000`00000000 fffffa80`0e371c00 00000000`00000001 : dxgmms1!VidSchiSubmitSystemCommand+0x39
    fffff880`09957910 fffff880`0f00a786 : 00000000`00000000 fffffa80`0e371d50 fffffa80`0e371c00 fffffa80`0e371c00 : dxgmms1!VidSchiSubmitQueueCommand+0x74
    fffff880`09957940 fffff880`0f03aaa3 : fffffa80`0e361af0 fffffa80`0e368000 fffffa80`0e371c00 6d4d6956`09957af9 : dxgmms1!VidSchiSubmitQueueCommandDirect+0x1e6
    fffff880`099579d0 fffff880`0f01f5dd : fffffa80`00000001 fffffa80`0e347010 fffffa80`0e37c000 fffffa80`0e37c000 : dxgmms1!VidSchiSubmitCommandPacketToQueue+0x15f
    fffff880`09957a40 fffff880`0f01f9f0 : fffff880`09957ba0 fffff8a0`0352de50 fffff880`09957ba0 fffff8a0`0352de50 : dxgmms1!VIDMM_GLOBAL::QueueSystemCommandAndWait+0xf9
    fffff880`09957ab0 fffff880`0f01b0a7 : 00000000`00000000 00000000`00000000 fffffa80`0d045170 fffff8a0`06ddbbb0 : dxgmms1!VIDMM_GLOBAL::QueueDeferredCommandAndWait+0x4c
    fffff880`09957b20 fffff880`0f001aa7 : fffff8a0`02db7980 fffff8a0`07382280 fffff880`09958390 00000000`00000000 : dxgmms1!VIDMM_GLOBAL::OpenOneAllocation+0x307
    fffff880`09957c10 fffff880`0fd415a9 : 00000000`00000000 fffff880`09958120 00000000`00000000 fffff8a0`073b1310 : dxgmms1!VidMmOpenAllocation+0xeb
    fffff880`09957c60 fffff880`0fd3aa5a : fffff880`09957f08 fffff8a0`03588070 fffff880`099580e0 fffff880`099580e0 : dxgkrnl!DXGDEVICE::CreateVidMmAllocations<_DXGK_ALLOCATIONINFO>+0x291
    fffff880`09957cf0 fffff880`0fd3c63f : fffff8a0`000d7000 fffff880`09958390 00000000`00000000 fffff8a0`000d7000 : dxgkrnl!DXGDEVICE::CreateAllocation+0x10ae
    fffff880`09958330 fffff880`0fd42b14 : 00000000`00000011 fffff900`c1ea779c 00000000`00000000 00000000`00000000 : dxgkrnl!DXGDEVICE::CreateStandardAllocation+0x367
    fffff880`09958490 00000000`00000000 : 00000000`00000000 00000000`00000000 00000000`00000000 00000000`00000000 : dxgkrnl!DxgkCddEnable+0x904
    
    
    SYMBOL_STACK_INDEX:  0
    
    SYMBOL_NAME:  dxgmms1!VIDMM_SEGMENT::TrimAllProcesses+14e
    
    FOLLOWUP_NAME:  MachineOwner
    
    MODULE_NAME: dxgmms1
    
    IMAGE_NAME:  dxgmms1.sys
    
    DEBUG_FLR_IMAGE_TIMESTAMP:  5164dc13
    
    STACK_COMMAND:  .cxr 0xfffff88009956c60 ; kb
    
    FAILURE_BUCKET_ID:  X64_0x7E_dxgmms1!VIDMM_SEGMENT::TrimAllProcesses+14e
    
    BUCKET_ID:  X64_0x7E_dxgmms1!VIDMM_SEGMENT::TrimAllProcesses+14e
    
    Followup: MachineOwner
    ---------

      My Computer


  Related Discussions
Our Sites
Site Links
About Us
Windows 7 Forums is an independent web site and has not been authorized, sponsored, or otherwise approved by Microsoft Corporation. "Windows 7" and related materials are trademarks of Microsoft Corp.

© Designer Media Ltd
All times are GMT -5. The time now is 17:21.
Find Us