
New
#1
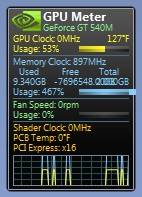
Random GPU spikes
My laptop has random graphics card spikes and I cant seem to find what is causing it. It doesn't seem to affect any games, it just makes the fan start and stop every other second which is pretty annoying.
My laptop has random graphics card spikes and I cant seem to find what is causing it. It doesn't seem to affect any games, it just makes the fan start and stop every other second which is pretty annoying.
The latest version of Sysinternals Process Explorer will show GPU usage by process.
CTRL+I to get the System Information dialog and select the GPU tab. Mouse-over the spike in the graph and it will tell you which process was responsible.
I did that but there are no spikes in the graph. Strange..
I think it is graphing the integrated card not the actual card.
If you click the 'Engines' button on the GPU tab you can choose which ones to graph. I'd like to think that they'll all show up there and it's defaulting to graphing just the first engine on the first card.
I have an integrated Intel and by default ProcExp only graphs engine 1 of 5 . You can watch everything it finds in real-time from the 'Engines' dialog.
If that doesn't work then I'm not sure where to go.
Maybe the GPU gadget prevents Process Explorer from getting the data. (I'm guessing now)


 Quote
Quote