Debugging source of unusually high RAM usage/allocation


  1. Posts : 5
    W7 x64
       #1

    Debugging source of unusually high RAM usage/allocation


    Hi guys,

    I seem to be having an issue with the RAM allocation on my system. This only occurs when playing the game "Wildstar". It may be on their end, since the game is in beta, but I would like to figure out what's causing the odd displaying of memory usage in my case.

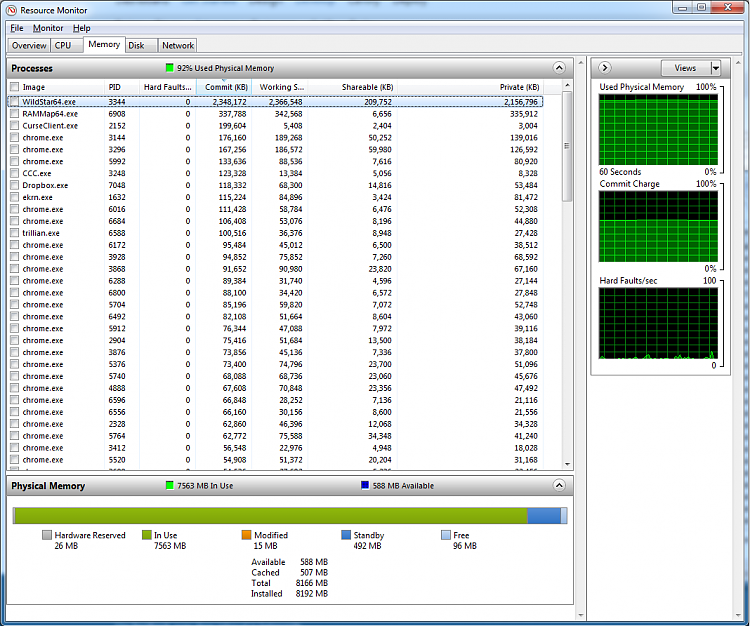
    In the Task Manage, while playing the game - memory usage is shown as ~95-98% total, while Wildstar itself is using 2-2.4GB. When I quit the game, memory usage is shown as 39-40%. I have 8GB of RAM, this means that Wildstar would be using ~55% which is ~4.4GB. However memory usage under processes only mentions 2-2.4GB, while percentage wise it seems to be using the double.

    Since this pushes me so close to 100% RAM usage I'd like to figure out how this is possible. I have made a couple of screenshots that should hopefully help out with this. I made an album of these, that include RamMap and the Resource Manager:
    https://imgur.com/a/FQb04
    Debugging source of unusually high RAM usage/allocation-rmap1.png

    Debugging source of unusually high RAM usage/allocation-rmap2.png

    Debugging source of unusually high RAM usage/allocation-rmap3.png

    Debugging source of unusually high RAM usage/allocation-rmap4.png

    Debugging source of unusually high RAM usage/allocation-rmap5.png

    Debugging source of unusually high RAM usage/allocation-rmap6.png

    Debugging source of unusually high RAM usage/allocation-rsrc1.png


    It would be awesome if anyone that has some knowledge in how Windows allocates RAM could have a look at these and perhaps enlighten me on what causes this. If additional information is required please let me know and I will do my best to provide you with it.

    Thanks!
    Last edited by 2bda6876e834; 16 May 2014 at 09:10.
      My Computer


  2. Posts : 25,847
    Windows 10 Pro. 64/ version 1709 Windows 7 Pro/64
       #2

    Please use this to post screen shot on this forum.
    Here is a tutorial by Brink.

    Screenshots and Files - Upload and Post in Seven Forums


      My Computer


  3. Posts : 5
    W7 x64
    Thread Starter
       #3

    Layback Bear said:
    Please use this to post screen shot on this forum.
    Here is a tutorial by Brink.

    Screenshots and Files - Upload and Post in Seven Forums


    Done. I personally prefer the imgur link since it allows people to view the images in full-size even when not having an account on this forum. People coming here from google with a similar issue will have an easier time that way :)
      My Computer


  4. Posts : 25,847
    Windows 10 Pro. 64/ version 1709 Windows 7 Pro/64
       #4

    It's a safer way for members to see. We don't have to off site and risk the chance of catching something. Those that arn't members are welcome to join the Forum.

    You are using all your ram with all those Chrome apps open.
    I don't see anything wrong you are just using it all.
      My Computer


  5. Posts : 5
    W7 x64
    Thread Starter
       #5

    Layback Bear said:
    It's a safer way for members to see. We don't have to off site and risk the chance of catching something. Those that arn't members are welcome to join the Forum.

    You are using all your ram with all those Chrome apps open.
    I don't see anything wrong you are just using it all.
    No - Chrome is not the issue. The issue is:
    - I have 8GB RAM total
    -- when Wildstar is closed, I am using ~40% RAM, which is 3.2GB
    -- when Wildstar is running, I am using ~95-98% RAM, which means that Wildstar is responsible for ~56% RAM usage.
    -- 56% RAM usage is almost 4.5GB.
    -- Wildstar only reports a usage of ~2.2GB in the task/resource-manager.

    This means that Wildstar is using pretty much double the RAM percentage wise as opposed to what it shows number wise (2.2GB).

    My question is how can I debug where that other ~2.2G is going, since it seemingly doesn't show up in the resource monitor/RamMap.

    EDIT: I have done another test that should make the issue more obvious.

    Shown below is the start of the test, with my current memory usage of 38% - or 3.04GB
    Debugging source of unusually high RAM usage/allocation-xplr1.png

    Here I just started Wildstar, just after loading everything the working set is shown as 2.3GB, or 28% of 8GB. This should put my total usage to 66%, however it displays as 73%. Already slightly off, but still within the margin:
    Debugging source of unusually high RAM usage/allocation-xplr2.png

    Here I have been running the program for about 20 minutes. As you can see, the working set is 3.05GB, so with our base of 3.04GB that should put us at 6.09GB total usage, which is 76% of 8GB. Yet the process explorer shows it as 96%, which leaves 20%, or 1.6GB unaccounted for. What is it allocated to? Why doesn't it show up in the process meter?
    Debugging source of unusually high RAM usage/allocation-xplr3.png
    Last edited by 2bda6876e834; 17 May 2014 at 09:55.
      My Computer


  6. Posts : 25,847
    Windows 10 Pro. 64/ version 1709 Windows 7 Pro/64
       #6

    I'm I correct Wildstar is a game of some kind you are playing online?

    WildStar (video game) - Wikipedia, the free encyclopedia


    WildStar is an upcoming fantasy/science fiction massively multiplayer online role-playing game that takes place on the fictional planet Nexus, where a mysterious and powerful race known as the Eldan has disappeared leaving behind a wealth of technology and secrets for players to explore.[
    Along with that you have 20 Chromes open at the same time.

    You are looking for a little over a gig of ram which Windows and hardware can be using. I have no idea why.
    In my opinion if you want to do what you are doing all at the same time you need to install more ram.
    In my opinion Windows Resource Monitor is the best to use measuring ram usage. It reports ram usage just the way Windows see the ram usage.
    Third party programs may differ a little.


    That is all the answers I got.
    Have a nice day.
      My Computer


  7. Posts : 5
    W7 x64
    Thread Starter
       #7

    Hi,

    Wildstar is indeed an online video-game. I do not have 20x Chrome opened at the same time - I have 20 Chrome processes running. This is part of how Chrome (Chromium) is built. Even with a single Chrome window open, multiple processes will be launched. As you can see in the screenshot, these use in total about 1.7GB. See: Chromium Blog: Multi-process Architecture

    I have attached a screenshot of the Resource Monitor as well, here it is:


    If I need more RAM for what I wish to do, then so be it. But before I make that decision I want to figure out the technical reason behind the way this is displayed. 20%, or 1.6GB of physical memory in use is not allocated to a process visible in any of the memory monitors, including the Resource Monitor. When simply counting the numbers ("Commit" in the Resource Monitor), I should be at 76% memory usage, not 96% as reported. I hope this makes this clarifies the issue/questions I am having.

    Cheers,
      My Computer


  8. Posts : 5
    W7 x64
    Thread Starter
       #8

    fwiw, I got this solved. It turns out Wildstar uses mmap() to map Wildstar-related data files into memory. This is why it doesn't appear to be attached to a process in the resource monitor, yet it is shown as used looking at total physical memory used.

    Hopefully this helps others that are in a similar situation.
      My Computer


  Related Discussions
Our Sites
Site Links
About Us
Windows 7 Forums is an independent web site and has not been authorized, sponsored, or otherwise approved by Microsoft Corporation. "Windows 7" and related materials are trademarks of Microsoft Corp.

© Designer Media Ltd
All times are GMT -5. The time now is 21:48.
Find Us