

Overview
Windows 7's Event Viewer has a new category of event logs that are known as Applications & Services Logs. This new category has a series of sub-categories that can be used to keep an eye on important events in the operating system.
Most of these sub-categories have an event log type named Operational, which is used to monitor events that can be used for diagnosing problems with your computer.
One of the sub-categories is titled Diagnostic-Performance and nested within it is an operational log that looks after the boot performance monitoring. The Event IDs related to this log are numbered 100 through 110 and by investigating all the Event ID 100 events, you can keep track of how long it takes your system to boot up, while Event IDs 101 through 110 will give you an indication of how your boot times have degraded since Windows was first installed.
Launching Event Viewer
There are two ways in which you can start Windows 7's Event Viewer:
- Navigate through Start/System & Security/Administrative Tools/Event Viewer.
- Click Start and type Event in the Search field then press Enter when you see Event Viewer highlighted at the top of the list under Programs.
]
Creating a Custom View
1. Go to the Action menu in the right-hand pane of the main Event Viewer window and click on Create Custom View, which will open the Create Custom View window.
2. Make sure the Logged option is set to the default setting of Any Time and ensure all the Event Level check boxes are checked.
3. Next, select the By Log option button if it isn't already selected and click the drop-down arrow and choose Applications & Services Logs.
4. Drill down through Applications & Services Logs/Microsoft/Windows/Diagnostics-Performance.
5. Expand the Diagnostics-Performance branch and check the Operational check box.
6. Click on a blank space in the main Event Viewer window then type 100 in the Includes/Excludes Event IDs box.
7. Click OK to bring up the Save Filter to Custom View dialog box and give the view a meaningful name such as Boot Times with an appropriate description in the text box below. Make sure Custom View is highlighted then click OK to save your new custom view.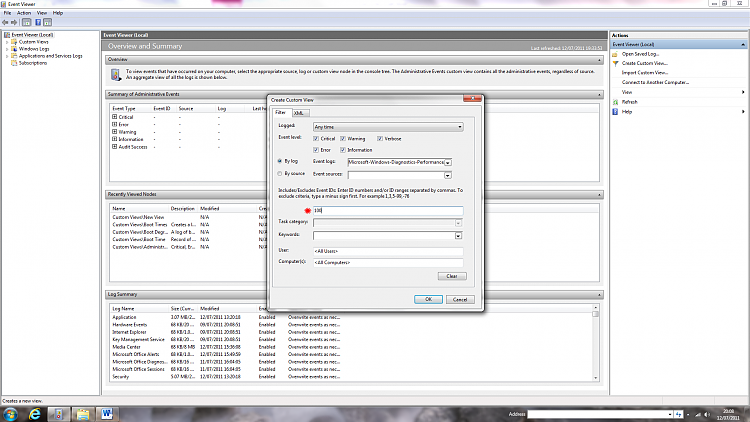
8. Repeat the above steps to create another custom view (good practice for you!) but this time type 101-110 in the Includes/Excludes Event IDs box and name the new custom view Boot Degradation Times with an appropriate description again.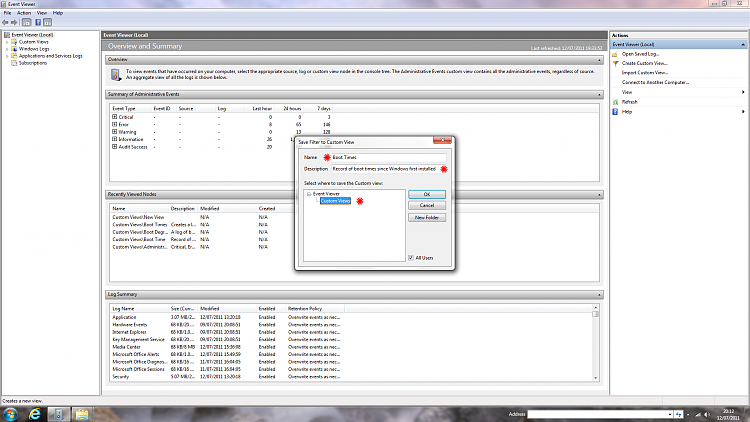
Investigating Boot Times
1. Go the left-hand pane of the main Event Viewer window and expand the Custom Views tree then click the new custom view Boot Times.

2. By looking at this custom view and clicking the Details tab, we can see the following:
- The computer has been booted 41 times with an event recorded for each time.
- The date of the first boot was 10th July 2011.
- The boot time was 63.9 seconds (63914/1000).

3. If we now look at a critical event, we can see a different picture emerge:
- The date of this event was 11 July 2011.
- The boot time had increased to 93.7 seconds (93748/1000)
4. The information under the Details tab can be very useful in determining an increase in boot times, but of course, there are several normal reasons why they vary:
- Windows Updates
- Microsoft Updates
- Driver Installations
- Software Installations
Investigating Boot Time Degradation
1. If we now look at the Boot Degradation custom view (you did create it, didn't you?) we can look at each event in detail. In this Event ID 106 we can see:
- There have been 21 events.
- The date of this event was 9th July 2011
- The degradation time was 23.6 seconds (23614/1000).
- The cause was due to the Background Prefetch Time

2. Event ID 101
This indicates that an application took longer than usual to start up and is usually the result of an update of some sort.
3. Event ID 102
This shows that a driver took longer than normal to initialize and once again is normally caused by an update.
4. Event ID 106
This event records that a background task such as prefetch took longer to finish than normal.
I hope this brief tutorial has given you a better appreciation of the way in which Event Viewer can help isolate reasons why Windows slows down over a period of time.
Boot Times - Monitor with Event Viewer
-
-
New #2
Why thank you. I've just contacted Brink in a fit of desperation as I'm unhappy with the layout and wasn't quite sure how to clean it up.
-
New #3
Great tutorial, Andrew. Well done! :)
To clean it up, you should add a few things such as a title, related articles etc. Shawn however, will most likely do it for you. If you want to do it your self, take a look at one the forum BB Code. It should cover most of the important stuff.
Windows 7 Forums - BB Code List
Last edited by JaidynM; 18 Aug 2011 at 02:52.
-
New #4
Hi.
Good tutorial but I don't think Windows logs each boot in eventlog. There are registry entries under HKLM\Software\Microsoft\Windows\CurrentVersion\Diagnostics\Performance\Boot where are stated minor and major threasholds for boot. My exprerience is that eventid 100 is logged only when minor threshold is exceeded. Do you know if that is the case? I would like Windows to log each boot - even if it's a good and fast boot - to get records out of those. So far I haven't figured out how to do it as I can't seem to be able to modify the registry entries under Boot as they are controlled by TrustedInstaller service.
-
New #5
-
New #6
think this is a prerequisite
gpedit.msc: [comp.conf] admin.templates>system>troubleshooting>windows boot perf. (enabled).

Boot Times - Monitor with Event Viewer
How to Monitor Boot Times in Event ViewerPublished by seavixen32


 Quote
Quote
Related Discussions