It appears to be a HDD related issue to me.
Code:
Child-SP          RetAddr           Call Site
fffff880`06dbf138 fffff800`032941a9 nt!KeBugCheckEx
fffff880`06dbf140 fffff800`03292e20 nt!KiBugCheckDispatch+0x69
fffff880`06dbf280 fffff800`032ab89a nt!KiPageFault+0x260
fffff880`06dbf410 fffff800`032abce2 nt!MiObtainSystemCacheView+0x186
fffff880`06dbf550 fffff800`032ab027 nt!MmMapViewInSystemCache+0xc2
fffff880`06dbf6c0 fffff800`032a9f8f nt!CcGetVacbMiss+0x177
fffff880`06dbf780 fffff800`03593762 nt!CcGetVirtualAddress+0x2e0
fffff880`06dbf810 fffff880`012d7fd2 nt!CcMapData+0xd2
fffff880`06dbf8d0 fffff880`012d3b4c Ntfs!NtfsReadMftRecord+0xb2
fffff880`06dbf980 fffff880`012b418a Ntfs!NtfsLookupInFileRecord+0x6c
fffff880`06dbfa10 fffff880`012ace2f Ntfs!NtfsUpdateFcbInfoFromDisk+0xaa
fffff880`06dbfb60 fffff880`012d0f69 Ntfs!NtfsOpenFile+0x2cf
fffff880`06dbfd50 fffff880`0123a40d Ntfs!NtfsCommonCreate+0xc49
fffff880`06dbff30 fffff800`0328c6f7 Ntfs!NtfsCommonCreateCallout+0x1d
fffff880`06dbff60 fffff800`0328c6b8 nt!KySwitchKernelStackCallout+0x27
fffff880`08bfb810 00000000`00000000 nt!KiSwitchKernelStackContinue
Ntfs file system errors are visible. It is either some failing HDD, or failing controller drivers, or a virus, or some antivirus causing these blockage.
I would suggest you to Uninstall Avast using Avast Uninstall Utility. Use Microsoft Security Essentials as your antivirus with windows inbuilt firewall, and free MBAM as the on demand scanner.
Download, install and update those, and then run full system scans with both of them, one by one.
Also, Scan the system for possible virus infection with the following programs.
Do some Disc checks.
- Reseat the sata and power.
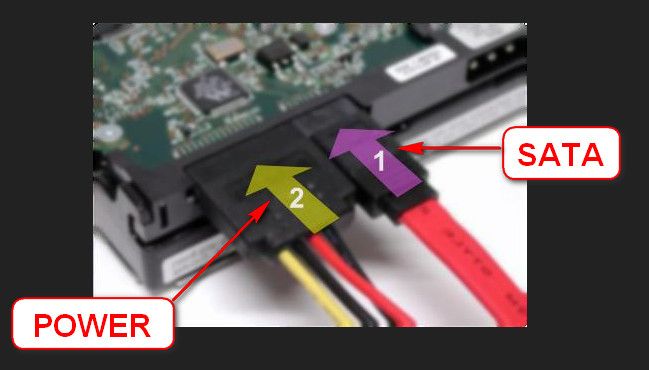
- Run chkdsk /f/r, following the option two of the tutorial Disk Check
- Seatool for dos: SeaTools | Seagate download
Burn it in a blank cd. boot from the CD, click on "Accept", wait for it to finish detecting the drives, then in the upper left corner select "Basic Tests", then select "Long Test" and let it run.
- You can use Win32 DiscImager to create a bootable USB and run Seatools for DOS. Follow this post to know how to make a bootable Seatools USB.
The network driver is old.
Code:
fffff880`04400000 fffff880`044a0000   Rt64win7   (deferred)
    Image path: \SystemRoot\system32\DRIVERS\Rt64win7.sys
    Image name: Rt64win7.sys
    Timestamp:        Tue Sep 27 20:20:33 2011 (4E81E2B9)
    CheckSum:         0009FB77
    ImageSize:        000A0000
    Translations:     0000.04b0 0000.04e4 0409.04b0 0409.04e4
Update it from Realtek , take the Win7 and WinServer 2008 R2 Auto Installation Program (SID:1581786) dated 2013/5/22.
I am not seeing anything about the display is failing in the recent dumps I have checked. But still, based on your observation, I searched and found that the display driver is outdated.
Code:
fffff880`0456b000 fffff880`045f8000   atikmpag   (deferred)
    Image path: \SystemRoot\system32\DRIVERS\atikmpag.sys
    Image name: atikmpag.sys
    Timestamp:        Thu Dec 20 01:02:55 2012 (50D21667)
    CheckSum:         00095A98
    ImageSize:        0008D000
    Translations:     0000.04b0 0000.04e4 0409.04b0 0409.04e4
Update your ATI/AMD display driver.
You can get it from the link in our forum, Latest AMD Catalyst Video Driver for Windows 7, or you may go to AMD Graphics Driver and Software and opt for Automatically Detect and Install the appropriate driver for your card.
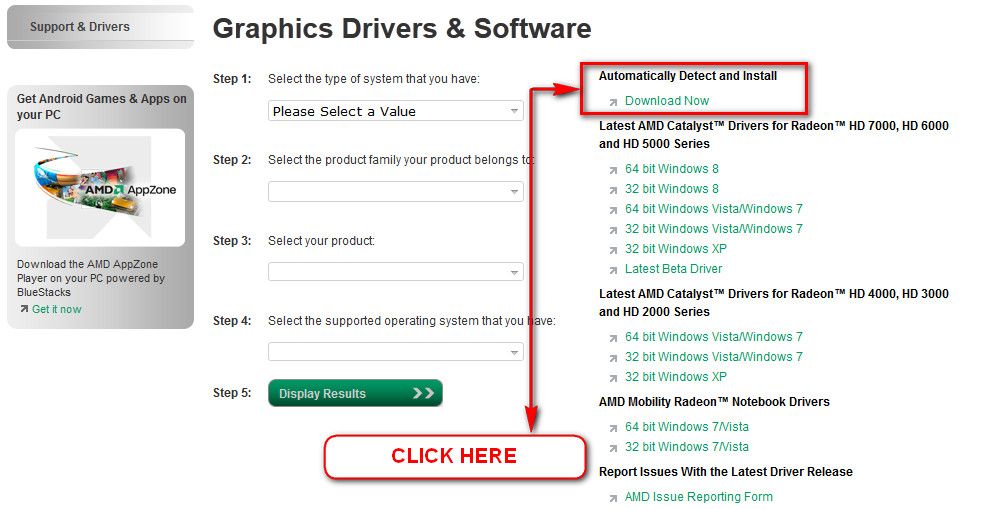
During installation, you may opt for advanced installation, and install the display driver only, not the Catalyst Control Center.
Stress test the Graphics Card using Furmark.
Video Card - Stress Test with Furmark
Is the computer hot? Report us the heat of the computer after a couple of hours of your normal usage. Upload a screenshot of the summery tab of Speccy.
Check if the Power Supply Unit (PSU) supplying adequate power to the computer or not.
eXtreme Power Supply Calculator
At least 30% free is safe. Also let us know about the wattage of the PSU.
Test your RAM modules for possible errors.
How to Test and Diagnose RAM Issues with Memtest86+
Run memtest for at least 8 passes, preferably overnight
Let us know the results.
___________________________________________________________________________
BSOD ANALYSIS:
Code:
....
*******************************************************************************
*                                                                             *
*                        Bugcheck Analysis                                    *
*                                                                             *
*******************************************************************************

Use !analyze -v to get detailed debugging information.

BugCheck A, {fffff702db1b2b60, 2, 0, fffff800032ab89a}

Probably caused by : memory_corruption ( nt!MiObtainSystemCacheView+186 )

Followup: MachineOwner
---------

3: kd> !analyze -v
*******************************************************************************
*                                                                             *
*                        Bugcheck Analysis                                    *
*                                                                             *
*******************************************************************************

IRQL_NOT_LESS_OR_EQUAL (a)
An attempt was made to access a pageable (or completely invalid) address at an
interrupt request level (IRQL) that is too high.  This is usually
caused by drivers using improper addresses.
If a kernel debugger is available get the stack backtrace.
Arguments:
Arg1: fffff702db1b2b60, memory referenced
Arg2: 0000000000000002, IRQL
Arg3: 0000000000000000, bitfield :
    bit 0 : value 0 = read operation, 1 = write operation
    bit 3 : value 0 = not an execute operation, 1 = execute operation (only on chips which support this level of status)
Arg4: fffff800032ab89a, address which referenced memory

Debugging Details:
------------------


READ_ADDRESS: GetPointerFromAddress: unable to read from fffff800034cc100
GetUlongFromAddress: unable to read from fffff800034cc1c0
 fffff702db1b2b60 Nonpaged pool

CURRENT_IRQL:  2

FAULTING_IP:
nt!MiObtainSystemCacheView+186
fffff800`032ab89a 418b44d508      mov     eax,dword ptr [r13+rdx*8+8]

CUSTOMER_CRASH_COUNT:  1

DEFAULT_BUCKET_ID:  WIN7_DRIVER_FAULT

BUGCHECK_STR:  0xA

PROCESS_NAME:  mscorsvw.exe

TRAP_FRAME:  fffff88006dbf280 -- (.trap 0xfffff88006dbf280)
NOTE: The trap frame does not contain all registers.
Some register values may be zeroed or incorrect.
rax=00000000000f43d4 rbx=0000000000000000 rcx=0000000018014840
rdx=00000000db63656b rsi=0000000000000000 rdi=0000000000000000
rip=fffff800032ab89a rsp=fffff88006dbf410 rbp=0000000000000000
 r8=0000000000018d93  r9=0000000000000000 r10=fffff80003462f40
r11=fffffa8006cde7f0 r12=0000000000000000 r13=0000000000000000
r14=0000000000000000 r15=0000000000000000
iopl=0         nv up ei pl nz na po nc
nt!MiObtainSystemCacheView+0x186:
fffff800`032ab89a 418b44d508      mov     eax,dword ptr [r13+rdx*8+8] ds:00000006`db1b2b60=????????
Resetting default scope

LAST_CONTROL_TRANSFER:  from fffff800032941a9 to fffff80003294c00

STACK_TEXT:
fffff880`06dbf138 fffff800`032941a9 : 00000000`0000000a fffff702`db1b2b60 00000000`00000002 00000000`00000000 : nt!KeBugCheckEx
fffff880`06dbf140 fffff800`03292e20 : 00000000`00000000 00000000`00000004 00000000`00000000 fffff6fc`c00a4200 : nt!KiBugCheckDispatch+0x69
fffff880`06dbf280 fffff800`032ab89a : fffff8a0`00167a70 00000000`00000000 fffff800`034cfa00 00000000`00000000 : nt!KiPageFault+0x260
fffff880`06dbf410 fffff800`032abce2 : 00000000`00000000 fffff880`06dbf600 00000000`00000000 f8a00038`ef080400 : nt!MiObtainSystemCacheView+0x186
fffff880`06dbf550 fffff800`032ab027 : fffff8a0`00167a70 fffff880`02fd7830 fffff880`06dbf6f8 fffff8a0`0fc7e140 : nt!MmMapViewInSystemCache+0xc2
fffff880`06dbf6c0 fffff800`032a9f8f : fffff8a0`00000000 00000000`0000000e fffff8a0`0f631b98 fffffa80`00000001 : nt!CcGetVacbMiss+0x177
fffff880`06dbf780 fffff800`03593762 : fffff980`00000001 00000000`15452c00 fffff880`06dbf8d8 fffff880`06dbf8d0 : nt!CcGetVirtualAddress+0x2e0
fffff880`06dbf810 fffff880`012d7fd2 : fffffa80`00100001 fffffa80`06c782d0 fffff8a0`0fc7e400 fffffa80`0000000e : nt!CcMapData+0xd2
fffff880`06dbf8d0 fffff880`012d3b4c : fffffa80`081dea30 fffffa80`07f93180 fffff8a0`102d6a98 00000000`00000801 : Ntfs!NtfsReadMftRecord+0xb2
fffff880`06dbf980 fffff880`012b418a : fffffa80`07f94858 fffff8a0`102d6a00 fffffa80`09577010 00000000`00000000 : Ntfs!NtfsLookupInFileRecord+0x6c
fffff880`06dbfa10 fffff880`012ace2f : fffffa80`081dea30 fffff8a0`102d6a90 fffffa80`081dea10 fffff8a0`102d6a90 : Ntfs!NtfsUpdateFcbInfoFromDisk+0xaa
fffff880`06dbfb60 fffff880`012d0f69 : fffff880`08bfb9d0 fffffa80`09577010 fffffa80`081dea30 00000000`00000000 : Ntfs!NtfsOpenFile+0x2cf
fffff880`06dbfd50 fffff880`0123a40d : fffffa80`081dea30 fffffa80`09577010 fffff880`08bfb9d0 fffffa80`09922600 : Ntfs!NtfsCommonCreate+0xc49
fffff880`06dbff30 fffff800`0328c6f7 : fffff880`08bfb940 00000000`00000000 00000000`00000000 00000000`00000000 : Ntfs!NtfsCommonCreateCallout+0x1d
fffff880`06dbff60 fffff800`0328c6b8 : 00000000`00000000 00000000`00000000 00000000`00000000 00000000`00000000 : nt!KySwitchKernelStackCallout+0x27
fffff880`08bfb810 00000000`00000000 : 00000000`00000000 00000000`00000000 00000000`00000000 00000000`00000000 : nt!KiSwitchKernelStackContinue


STACK_COMMAND:  kb

FOLLOWUP_IP:
nt!MiObtainSystemCacheView+186
fffff800`032ab89a 418b44d508      mov     eax,dword ptr [r13+rdx*8+8]

SYMBOL_STACK_INDEX:  3

SYMBOL_NAME:  nt!MiObtainSystemCacheView+186

FOLLOWUP_NAME:  MachineOwner

MODULE_NAME: nt

DEBUG_FLR_IMAGE_TIMESTAMP:  5147d9c6

IMAGE_NAME:  memory_corruption

FAILURE_BUCKET_ID:  X64_0xA_nt!MiObtainSystemCacheView+186

BUCKET_ID:  X64_0xA_nt!MiObtainSystemCacheView+186

Followup: MachineOwner
---------


 Quote
Quote