Hello Xerat and welcome to the Forums,
Good choice comming to SF, we're the best Windows 7 knowledge base on the web
Please uninstall Ad Aware as it might be contributing to your problems.
First remove it via the Control Panel and then please use the specialized removal utility from this list.
----------
Please Uninstall Avast!;
- Open the Start Menu by clicking on the
 .
. - Click on Control Panel and under Programs click on Uninstall a program.
- Wait for the list to update, and when done, please Right-click on Avast! and select Uninstall/Change.
- Follow the on screen instructions, and when prompted, please restart your computer.
- When you are done, please download the Avast! Uninstall Utility and follow the on screen instructions.
- Restart your computer.
Warning

are you aware that having multiple AV's can cause problems for your PC?
Having
multiple AV's that all offer real-time protection will cause them to
interfere with each other, and that will result in the opposite of what you are trying to achieve.
Problems that can be caused include a
slow computer,
false positives,
conflict of programs, causing them to
stop working,
freeze or
use way to much RAM, and last and most important,
more vulnerability to infections.
----------
Please download Microsoft Security Essentials from here;
- Download the file and save it to your desktop.
- Double click the file and follow the on-screen instructions.
- Restart your machine after installing MSE and please run a full scan and report back anything found.
----------
The following software is contributing to your problems, please uninstall it;
Code:
Start Menu\Programs\DAEMON Tools Lite Public:Start Menu\Programs\DAEMON Tools Lite Public
- Download and install Revo Uninstaller.
- Right click the program that needs to be removed, and click on Uninstall.
- Select "Advanced" as uninstall mode.
- Let Revo remove the program, and afterwards please follow the displayed steps to remove all entries of the program as well.
- When all programs have been uninstalled, please restart your machine.
----------
Please reduce the items that run at start up. You basically only need your anti virus to run at start up, all other programs are not necessary and can be removed from the start up list.
Check this tutorial to see how to add or remove start up items.
----------
Your 2 most recent dump files points to this;
Code:
*******************************************************************************
*                                                                             *
*                        Bugcheck Analysis                                    *
*                                                                             *
*******************************************************************************

Use !analyze -v to get detailed debugging information.

BugCheck 116, {fffffa8007154010, fffff880073c56b4, ffffffffc00000b5, a}

Unable to load image \SystemRoot\system32\DRIVERS\nvlddmkm.sys, Win32 error 0n2
*** WARNING: Unable to verify timestamp for nvlddmkm.sys
*** ERROR: Module load completed but symbols could not be loaded for nvlddmkm.sys
Probably caused by : nvlddmkm.sys ( nvlddmkm+14d6b4 )

Followup: MachineOwner
---------
Usual cause: GPU driver failure.
More info  Bug Check 0x116.
----------
Code:
start             end                 module name
fffff880`07278000 fffff880`07d6f000   nvlddmkm T (no symbols)
    Loaded symbol image file: nvlddmkm.sys
    Image path: \SystemRoot\system32\DRIVERS\nvlddmkm.sys
    Image name: nvlddmkm.sys
    Timestamp:        Thu Sep 12 07:16:00 2013 (52314E10)
    CheckSum:         00AC9E83
    ImageSize:        00AF7000
    Translations:     0000.04b0 0000.04e4 0409.04b0 0409.04e4
I am guessing that you are using the latest 327.23 WHQL driver?
This one is a bit buggy and is known to cause your issue. Please downgrade the driver to 314.22;
Please follow this;
Lately we have experienced some issues with the latest driver. Install the 314.22 WHQL only.
- Uninstall All nvidia items in Control Panel > Programs and features
- 3D Vision Control Driver
- 3D Vision Driver
- Graphics Driver
- HD Audio Driver
- PhysX
- nvidia Update
(Are you using nvidia chipset drivers? If so, dont uninstall anything other than those are listed). - Now follow Drivers - Clean Left over Files after Uninstalling
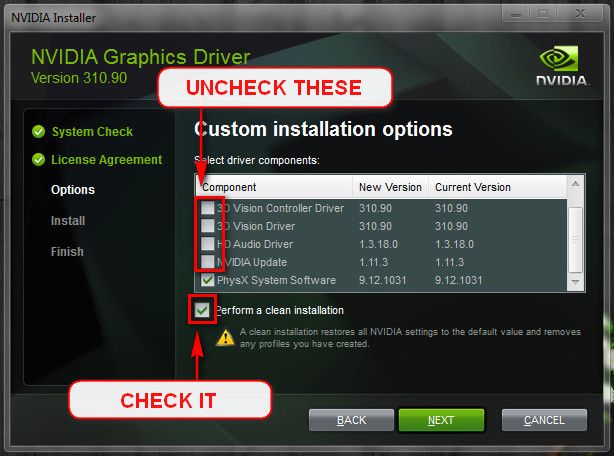
- Boot normally now. Go to Drivers - Download NVIDIA Drivers, Download 314.22 WHQL. While installing, Select Custom (Advanced) install. In the next page, follow this settings:
----------
After downgrading the driver, please preform the following hardware test;
Stress test the graphics card using Furmark GPU Stress Test.
Information
During the test please check the screen for
artifacts.
The purpose of this test is to make your machine crash and create dump files so that we can pinpoint the cause of your problem.
Tip
Please run Furmark once when your machine has just started, and once again when your machine has been active for several hours.
----------
The next two dump files after that points to the following;
Code:
*******************************************************************************
*                                                                             *
*                        Bugcheck Analysis                                    *
*                                                                             *
*******************************************************************************

Use !analyze -v to get detailed debugging information.

BugCheck 1E, {0, 0, 0, 0}

*************************************************************************
***                                                                   ***
***                                                                   ***
***    Either you specified an unqualified symbol, or your debugger   ***
***    doesn't have full symbol information.  Unqualified symbol      ***
***    resolution is turned off by default. Please either specify a   ***
***    fully qualified symbol module!symbolname, or enable resolution ***
***    of unqualified symbols by typing ".symopt- 100". Note that   ***
***    enabling unqualified symbol resolution with network symbol     ***
***    server shares in the symbol path may cause the debugger to     ***
***    appear to hang for long periods of time when an incorrect      ***
***    symbol name is typed or the network symbol server is down.     ***
***                                                                   ***
***    For some commands to work properly, your symbol path           ***
***    must point to .pdb files that have full type information.      ***
***                                                                   ***
***    Certain .pdb files (such as the public OS symbols) do not      ***
***    contain the required information.  Contact the group that      ***
***    provided you with these symbols if you need this command to    ***
***    work.                                                          ***
***                                                                   ***
***    Type referenced: ExceptionRecord                               ***
***                                                                   ***
*************************************************************************
*************************************************************************
***                                                                   ***
***                                                                   ***
***    Either you specified an unqualified symbol, or your debugger   ***
***    doesn't have full symbol information.  Unqualified symbol      ***
***    resolution is turned off by default. Please either specify a   ***
***    fully qualified symbol module!symbolname, or enable resolution ***
***    of unqualified symbols by typing ".symopt- 100". Note that   ***
***    enabling unqualified symbol resolution with network symbol     ***
***    server shares in the symbol path may cause the debugger to     ***
***    appear to hang for long periods of time when an incorrect      ***
***    symbol name is typed or the network symbol server is down.     ***
***                                                                   ***
***    For some commands to work properly, your symbol path           ***
***    must point to .pdb files that have full type information.      ***
***                                                                   ***
***    Certain .pdb files (such as the public OS symbols) do not      ***
***    contain the required information.  Contact the group that      ***
***    provided you with these symbols if you need this command to    ***
***    work.                                                          ***
***                                                                   ***
***    Type referenced: ContextRecord                                 ***
***                                                                   ***
*************************************************************************
*************************************************************************
***                                                                   ***
***                                                                   ***
***    Either you specified an unqualified symbol, or your debugger   ***
***    doesn't have full symbol information.  Unqualified symbol      ***
***    resolution is turned off by default. Please either specify a   ***
***    fully qualified symbol module!symbolname, or enable resolution ***
***    of unqualified symbols by typing ".symopt- 100". Note that   ***
***    enabling unqualified symbol resolution with network symbol     ***
***    server shares in the symbol path may cause the debugger to     ***
***    appear to hang for long periods of time when an incorrect      ***
***    symbol name is typed or the network symbol server is down.     ***
***                                                                   ***
***    For some commands to work properly, your symbol path           ***
***    must point to .pdb files that have full type information.      ***
***                                                                   ***
***    Certain .pdb files (such as the public OS symbols) do not      ***
***    contain the required information.  Contact the group that      ***
***    provided you with these symbols if you need this command to    ***
***    work.                                                          ***
***                                                                   ***
***    Type referenced: ExceptionRecord                               ***
***                                                                   ***
*************************************************************************
*************************************************************************
***                                                                   ***
***                                                                   ***
***    Either you specified an unqualified symbol, or your debugger   ***
***    doesn't have full symbol information.  Unqualified symbol      ***
***    resolution is turned off by default. Please either specify a   ***
***    fully qualified symbol module!symbolname, or enable resolution ***
***    of unqualified symbols by typing ".symopt- 100". Note that   ***
***    enabling unqualified symbol resolution with network symbol     ***
***    server shares in the symbol path may cause the debugger to     ***
***    appear to hang for long periods of time when an incorrect      ***
***    symbol name is typed or the network symbol server is down.     ***
***                                                                   ***
***    For some commands to work properly, your symbol path           ***
***    must point to .pdb files that have full type information.      ***
***                                                                   ***
***    Certain .pdb files (such as the public OS symbols) do not      ***
***    contain the required information.  Contact the group that      ***
***    provided you with these symbols if you need this command to    ***
***    work.                                                          ***
***                                                                   ***
***    Type referenced: ContextRecord                                 ***
***                                                                   ***
*************************************************************************
Probably caused by : ntkrnlmp.exe ( nt!KiKernelCalloutExceptionHandler+e )

Followup: MachineOwner
---------
Usual cause: Incompatible hardware, failing drivers or failing system service.
More info Bug Check 0x1E.
----------
Have you recently installed any new hardware?
If not, please preform the following scan to rule out any faulty Windows drivers;
Please use the SFC /SCANNOW command as displayed in option two of this tutorial.
- Click on the .
- Open an elevated command prompt.
- Type "SFC /SCANNOW" without the quotations.
- Let SFC do it's thing, and then prompted to, restart.
If SFC found and repaired anything, please do the following: - When restarted, open an elevated command prompt.
- Type (or copy) the following, this will create a .txt file on your desktop;
findstr /c:"[SR]" %windir%\Logs\CBS\CBS.log >"%userprofile%\Desktop\sfcdetails.txt" - In your next reply, please attach this file using the method displayed in this tutorial.
----------
If SFC finds no integrity violations, please enable Driver Verifier to pinpoint the failing driver;
Please follow this;
Run Driver Verifier for 24 hours or the occurrence of the next crash, whichever is earlier.
Information
Why Driver Verifier:
It puts a stress on the drivers, ans so it makes the unstable drivers crash. Hopefully the driver that crashes is recorded in the memory dump.
How Can we know that DV is enabled:
It will make the system bit of slow, laggy.
Warning
Before enabling DV, make it sure that you have earlier System restore points made in your computer. You can check it easily by using
CCleaner looking at Tools > System Restore.
If there is no points,
make a System Restore Point manually before enabling DV.
----------
And the last dump file points to this;
Code:
*******************************************************************************
*                                                                             *
*                        Bugcheck Analysis                                    *
*                                                                             *
*******************************************************************************

Use !analyze -v to get detailed debugging information.

BugCheck 4E, {99, 994f4, 2, 993f3}

Probably caused by : memory_corruption ( nt!MiBadShareCount+4c )

Followup: MachineOwner
---------
Usual cause: Failing RAM, a corrupted driver.
More info Bug Check 0x4E_99.
----------
You said that you already had run Memtest, but please do it again by following this;
Please run Memtest86+ to test your RAM for issues.
Tip
Let
Memtest run for
at least 10 passes and preferably overnight as it may take very long to complete.
Especially read part three of the
tutorial, which explains you to test each RAM stick in all DIMM slots to filter out failing slots.
Suppose you have got the result like that:
No code has to be inserted here. It is a RAM, a bad RAM.
But if you have got a result like that:
No code has to be inserted here. It is a motherboard issue. The particular slot is bad.
If Memtest comes out clean, we have the dump files from Driver Verifier to pinpoint the cause.
Good luck and keep us posted,
Nommy


 Quote
Quote
