BSOD chrome.exe bugcheck 124 repeatingly.


  1. Posts : 2
    win 7 pro 64bit
       #1

    BSOD chrome.exe bugcheck 124 repeatingly.


    Hi, I have had this issues for a while now. All my system infos are on my profile.

    I have done yesterday:
    - Hard drive test with the WD diagnotic tool: no errors.
    - memory test 21 hours with memtest86+ 5.01: no errors
    - 3x cpustab test no error whatsoever and no overheating nor overclocking (other than the 1090T "built in" OC at 3.2GHz
    - updated all bios, drivers etc etc.

    and yet I am constantly getting BSOD while playing FB games and none while playing online games such as WOT, WOW Diablo III etc... I am stomped and really need some help. Here are the last minidump file infos and I have also attached SF zip file


    Microsoft (R) Windows Debugger Version 6.12.0002.633 AMD64
    Copyright (c) Microsoft Corporation. All rights reserved.


    Loading Dump File [C:\Windows\Minidump\013014-20514-01.dmp]
    Mini Kernel Dump File: Only registers and stack trace are available

    WARNING: Whitespace at end of path element
    Symbol search path is: SRV*c:\symbols*http://msdl.microsoft.com/download/symbols

    Executable search path is:
    Windows 7 Kernel Version 7601 (Service Pack 1) MP (6 procs) Free x64
    Product: WinNt, suite: TerminalServer SingleUserTS
    Built by: 7601.18247.amd64fre.win7sp1_gdr.130828-1532
    Machine Name:
    Kernel base = 0xfffff800`03001000 PsLoadedModuleList = 0xfffff800`032446d0
    Debug session time: Thu Jan 30 18:06:59.904 2014 (UTC - 5:00)
    System Uptime: 6 days 6:27:00.554
    Loading Kernel Symbols
    ...............................................................
    ................................................................
    ......................................
    Loading User Symbols
    Loading unloaded module list
    ......
    *******************************************************************************
    * *
    * Bugcheck Analysis *
    * *
    *******************************************************************************

    Use !analyze -v to get detailed debugging information.

    BugCheck 124, {0, fffffa8007e1b028, b654a000, 1c000145}

    Probably caused by : hardware

    Followup: MachineOwner
    ---------

    4: kd> !analyze -v
    *******************************************************************************
    * *
    * Bugcheck Analysis *
    * *
    *******************************************************************************

    WHEA_UNCORRECTABLE_ERROR (124)
    A fatal hardware error has occurred. Parameter 1 identifies the type of error
    source that reported the error. Parameter 2 holds the address of the
    WHEA_ERROR_RECORD structure that describes the error conditon.
    Arguments:
    Arg1: 0000000000000000, Machine Check Exception
    Arg2: fffffa8007e1b028, Address of the WHEA_ERROR_RECORD structure.
    Arg3: 00000000b654a000, High order 32-bits of the MCi_STATUS value.
    Arg4: 000000001c000145, Low order 32-bits of the MCi_STATUS value.

    Debugging Details:
    ------------------


    BUGCHECK_STR: 0x124_AuthenticAMD

    CUSTOMER_CRASH_COUNT: 1

    DEFAULT_BUCKET_ID: VISTA_DRIVER_FAULT

    PROCESS_NAME: chrome.exe

    CURRENT_IRQL: f

    STACK_TEXT:
    fffff880`009bab08 fffff800`035f8a3b : 00000000`00000124 00000000`00000000 fffffa80`07e1b028 00000000`b654a000 : nt!KeBugCheckEx
    fffff880`009bab10 fffff800`0318d463 : 00000000`00000001 fffffa80`06be22c0 00000000`00000000 fffffa80`06be2310 : hal!HalBugCheckSystem+0x1e3
    fffff880`009bab50 fffff800`035f8700 : 00000000`00000728 fffffa80`06be22c0 fffff880`009baeb0 00000000`00000000 : nt!WheaReportHwError+0x263
    fffff880`009babb0 fffff800`035f8052 : fffffa80`06be22c0 fffff880`009baeb0 fffffa80`06be22c0 00000000`00000000 : hal!HalpMcaReportError+0x4c
    fffff880`009bad00 fffff800`035ebe8f : 00000000`00000000 00000000`00000001 fffff880`009baf30 00000000`00000000 : hal!HalpMceHandler+0x9e
    fffff880`009bad40 fffff800`030754ac : 00000000`00000000 00000000`00000000 00000000`00000000 00000000`00000000 : hal!HalHandleMcheck+0x47
    fffff880`009bad70 fffff800`03075313 : 00000000`00000000 00000000`00000000 00000000`00000000 00000000`00000000 : nt!KxMcheckAbort+0x6c
    fffff880`009baeb0 00000000`6906d452 : 00000000`00000000 00000000`00000000 00000000`00000000 00000000`00000000 : nt!KiMcheckAbort+0x153
    00000000`00268e60 00000000`00000000 : 00000000`00000000 00000000`00000000 00000000`00000000 00000000`00000000 : 0x6906d452


    STACK_COMMAND: kb

    FOLLOWUP_NAME: MachineOwner

    MODULE_NAME: hardware

    IMAGE_NAME: hardware

    DEBUG_FLR_IMAGE_TIMESTAMP: 0

    FAILURE_BUCKET_ID: X64_0x124_AuthenticAMD_PROCESSOR_CACHE

    BUCKET_ID: X64_0x124_AuthenticAMD_PROCESSOR_CACHE

    Followup: MachineOwner
    ---------

    4: kd> lmvm hardware
    start end module name

    thank you kindly for your time
      My Computer


  2. Posts : 3,056
    Windows 10
       #2

    Hi JGPV welcome to SF :).

    A "stop 0x124" is fundamentally different to many other types of bluescreens because it stems from a hardware complaint. Stop 0x124 minidumps contain very little practical information, and it is therefore necessary to approach the problem as a case of hardware in an unknown state of distress. - H2SO4
    The generic nature of the 0x124 (Arg1=0) stop code means we would have to take
    the trail & error approach.

    The errors of the two bugchecks are pretty similar, and claim a L1-Cache Data Read and Data Write error.
    Code:
    Error Type    : Cache error
    Operation     : Data Read
    
    ===============================================================================
    Section 2     : x86/x64 MCA
    -------------------------------------------------------------------------------
    Descriptor    @ fffffa8007ded138
    Section       @ fffffa8007ded2c0
    Offset        : 664
    Length        : 264
    Flags         : 0x00000000
    Severity      : Fatal
    
    Error         : DCACHEL1_DRD_ERR (Proc 4 Bank 0)
      Status      : 0xb62ba000c5000135
      Address     : 0x00000001b09c5d00
      Misc.       : 0x0000000000000000
    Code:
    Error Type    : Cache error
    Operation     : Data Write
    
    ===============================================================================
    Section 2     : x86/x64 MCA
    -------------------------------------------------------------------------------
    Descriptor    @ fffffa8007e1b138
    Section       @ fffffa8007e1b2c0
    Offset        : 664
    Length        : 264
    Flags         : 0x00000000
    Severity      : Fatal
    
    Error         : DCACHEL1_DWR_ERR (Proc 4 Bank 0)
      Status      : 0xb654a0001c000145
      Address     : 0x00000001d4f72e80
      Misc.       : 0x0000000000000000
    Do you have any spare parts (or another PC) to test with?
    The usual suspect of this kind of BCCode is the CPU but it's often not the the case which is why we need
    to test other components to rule them out as the cause.
    How old are your components?


    What is the make, model and age of your PSU?
    Fill out this form and post back the result:


    Good practice, open up the case and re-seat all types of connection.

    • SATA Cables (HDD/SSD/ODD).
    • SATA-Power.
    • Motherboard 24-pin.
    • Motherboard 4/8-pin (CPU).
    • Re-seat the RAM.
    • Re-seat the GPU.

    Make sure that every slot / cable head is free of dust or other obstruction.
    Make sure that every connection is seating properly and firmly in-place.

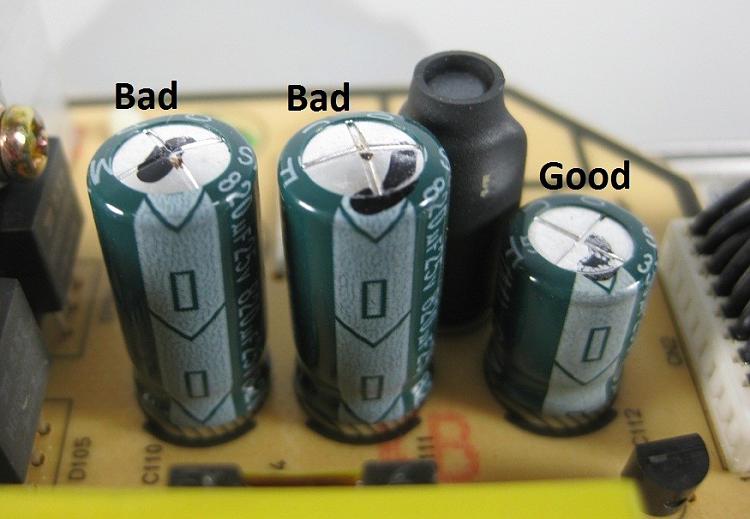
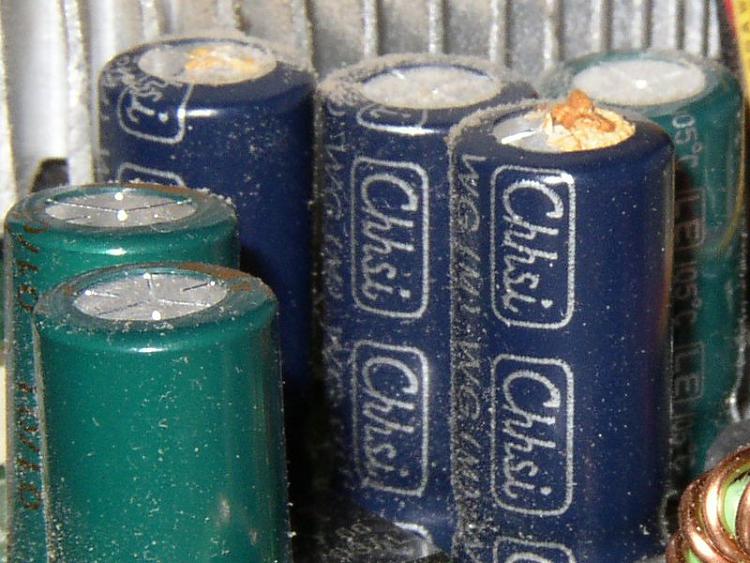
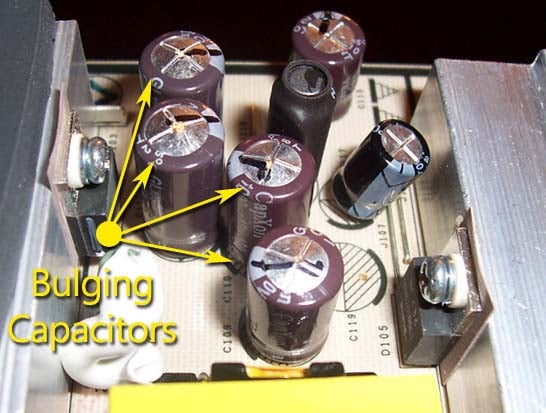
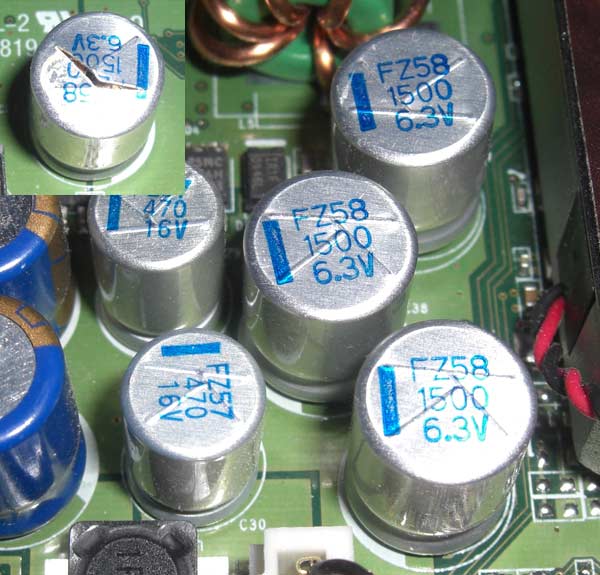
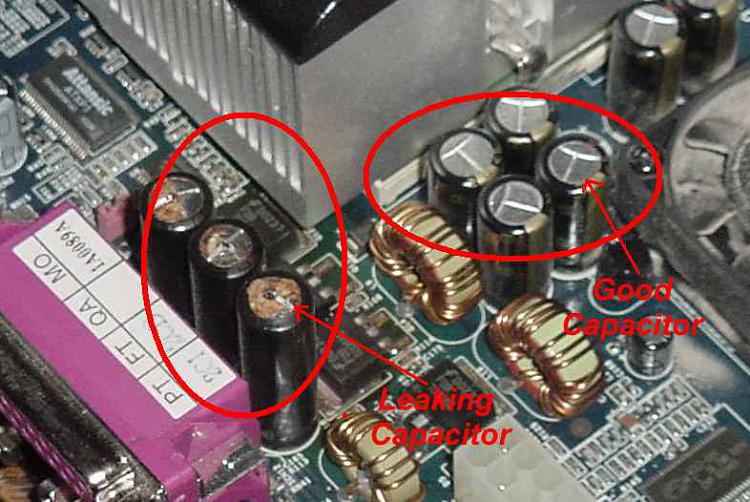
    Also have a look at the motherboard and the GPU, search for any "bad caps", bulky, leaking bloated capacitors.

    i.e


    Test for thermals and stability:

    • Download HWinfo and post a Screenshot of the sensors window, one at idle and another while putting load on the PC using Prime95 for the CPU side and Furmark for the GPU.
      • Before running Prime95 make sure to enable Round-off checking (see 1st post under the tutorial).

         Note
      It is not mandatory to run both tests simultaneously, although possible as long as the temperatures are under constant monitoring.

    Reset the BIOS back to default:

       Note
    Write down the current value of the SATA Mode!
    Its either AHCI or IDE.
    After resetting the CMOS go back and verify the value for SATA Mode is what it was
    when the OS was installed.

    If any component is overclocked reset it back to stock speeds!


    Good places to read more:

      My Computer


  3. Posts : 2
    win 7 pro 64bit
    Thread Starter
       #3

    this thread can be closed, stress test had no errors, max temp was 64 deg celsius BUT I found some bulging capacitors on my motherboard, think it's time for a new motherboard and a reinstall...just awesome. Thank you for your quick reply and great infos.
      My Computer


  4. Posts : 3,056
    Windows 10
       #4

    Thank you for reporting back :).
    Now you have a choice, get a similar Motherboard or upgrade the platform all together.
      My Computer


  Related Discussions
Our Sites
Site Links
About Us
Windows 7 Forums is an independent web site and has not been authorized, sponsored, or otherwise approved by Microsoft Corporation. "Windows 7" and related materials are trademarks of Microsoft Corp.

© Designer Media Ltd
All times are GMT -5. The time now is 15:40.
Find Us