
New
#70
Bug in Windows 7 RTM
-
-
-
-
New #73
-
New #74
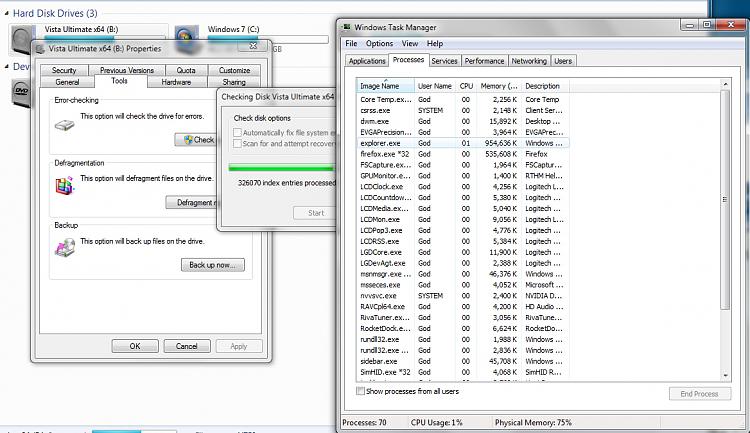
I just ran it again and checked the process Tab and explorer went from 123MB to 954MB and it was constant in it's ascent so I guess if there were fore files then it may have gone considerably higher, also you will notice in the first screen I posted of the performance Tab, the memory usage did go back to normal immediately after completion of each test.
-
New #75
I misinterpreted your screenshot....also you will notice in the first screen I posted of the performance Tab, the memory usage did go back to normal immediately after completion of each test.
But, I do notice that you are not duplicating the test. Both check boxes should be selected to emulate chkdsk /r.
Apples and oranges. Can you test again?
-
-
New #77
Now you have seen what the buzz is about. Interesting that you get ~1GB, ~2GB and ~3GB results. I have not cross-referenced these to your file counts, I am assuming they corelate. If they do, your results are consistent with the MD's initial analysis.
I am glad that I did not bother with the Google re: AMD/nVidia.
Muad Dib, MD, will always be "The Doctor" in my mind as a result of this examination. Once I get an acronym in my head, I can't shake it out.While in the Resource Monitor-Memory tab I right clicked the hung Explorer process (after cancelling the repair) and selected "Analyze Wait States". It reported that one of the threads in the process was waiting for a Network I/O to complete....(?)
-
New #78
I duplicated my original test to confirm that CHKDSK /R executed from a command window does relenquish its memory usage when aborted by closing the command window or via the Task Manager - Process Window.
-
New #79
Access is denied...
Can't run here... what are the commands? CHKDSK <C:> /r
I have two HDs let's see if this crash my system...


 Quote
Quote


