CPU and RAM usage keeps spiking?

Page 1 of 2 12 LastLast

  1. Posts : 5
    Windows 7 Home Premium SP1 X64
       #1

    CPU and RAM usage keeps spiking?


    I just reinstalled windows because of a virus on my PC and now in task manager my CPU usage can spike up to 40% and my ram stays at around 40-45% usage...
    Also my taskbar and start menu stop responding sometimes...
    Thanks.

    Processes:
    Gyazo - b7bde5ff8d9d7837aed4c2c1a445d429.png

    Services:
    Gyazo - 1d1384f51136961812201d2b881bcee8.png
    Gyazo - 9378a42e70d08a3e47f8751637689024.png
    Gyazo - 4c39cb31a22cc8c75cdfdd064020f333.png
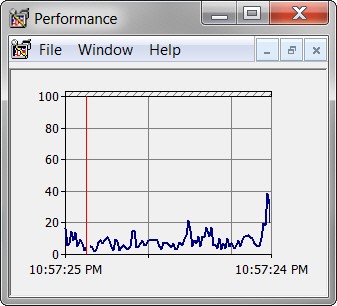
    Performance:
    Gyazo - fa4e8d114faaf8bef7ec4a2fbc2dafe3.png

    Resource Monitor:
    Gyazo - 39cdcd5dd022ddc9a5ee7ba563405698.png
    Gyazo - e2f983540741fa433d4d4d1a48dff5a7.png

    Sorry, I didnt have time to upload the screenshots :3
      My Computer


  2. Posts : 2,752
    Windows 7 Pro x64 (1), Win7 Pro X64 (2)
       #2

    You need to complete your "specs", else we have no idea at all what your machine looks like.

    Also, when you take a screenshot of say "processes" or "services" that you want us to look at, be sure to spread the columns so that we can read all the text that's in each cell and which might be useful to see.

    Also, when a big "list" (like processes or services) is posted, sorting it (by clicking on that column heading) into some user-friendly order (or to demonstrate what you want to demonstrate) is recommended. For example, alphabetical "name" sequence is very very useful.

    Also, your "performance" screenshot didn't show any of the graphs, if that's what you wanted to show us. Each pane was absolutely black. If you wanted to show just the numbers at the bottom, why not take a screenshot of just that area instead of the entire window? And the numbers on "performance" are very similar to the numbers on "resource monitor", so one or the other would probably have been sufficient if you wanted to convey memory usage (since the graphs are all black anyway).

    But just from looking at what you've posted, I don't know that using about 40-50% of your 8GB memory is wrong or problematic or unusual. I have similar number percentages, but of course it will vary widely depending on what you're running. Certainly you seem to have 11 open Chrome windows (and processes), so that's got to take up some storage. Perhaps running one window with 11 tabs might be more efficient.

    CPU spiking is often the result of some program doing something on a regular periodic basis. For example, a hardware monitor program (like Aida64) that updates its display every 4-5 seconds is going to use some extra CPU cycles every 4-5 seconds to accomplish that. It will appear as a "spike" every 4-5 seconds in a timeline of CPU usage, and it's obviously completely explained and expected. Not unusual. The physical size of the spike (and your 40% CPU usage spike does sound very high) is obviously related to the strength of your CPU, with a weaker machine producing a bigger percentage spike for the identical reason a much stronger machine might show it as just a tiny spike. Since we have no specs for your machine, it's not clear what might be reasonable or unreasonable.

    So only activating some type of task logging to a file (through a software tool) might get to the bottom of exactly which process/service is actually responsible for those spikes. And even then, it might be totally explainable. But I grant you a spike up to 40% does seem quite large, unless you have a relatively weak CPU.


    Just to allow you to have another perspective on CPU usage over time, Windows provides a "performance monitor" MSC service (conventionally named PERFMON by its users, and similar to the performance monitoring that you've taken screenshots of but with a different GUI) that is like an EKG for your CPU. It shows anything you want it to display (selected from its huge list of system items available for charting) displayed over time, with the scale/graph moving horizontally to the left every second. You can customize it to have different colors for different things for easier viewing, but intelligent use of this tool should really be isolated to one or two items at most, which don't step on each other in the graph but which provide you with exactly what you're trying to see.

    Download the attachment I'm posting, unzip it, and then RUN (or double-click to launch) it. It is a PERFMON launcher that I use that shows only CPU usage graphed over time. If you size it like I've shown in this screenshot and let it run in a corner of your screen, you'll have a very nice graphical "EKG" of your CPU's heartbeat and "horsepower usage" over time. It should also reflect this "CPU spiking" you've observed


    Note that the display window can be stretched and resized to show a longer period of time, and a more granular percentage CPU scale. I feel the size I've shown provides sufficient percentage detail scale lines (Y-axis) and about 2 1/2 minutes of time (X-axis) to satisfy my curiosity and interest. You can resize it to your own likes. It will "slide" the display to the left one increment each second, and will have the vertical red marker wrap around from right-edge back to left edge when it reaches the right side limit.
    CPU and RAM usage keeps spiking? Attached Files
      My Computer


  3. Posts : 5
    Windows 7 Home Premium SP1 X64
    Thread Starter
       #3
      My Computer


  4. Posts : 2,752
    Windows 7 Pro x64 (1), Win7 Pro X64 (2)
       #4

    You didn't spread the "image name" first column, so the complete name of each process is not shown when it's longer than the current column width allows.

    Also, you didn't click on that first "image name" column which would have sorted the processes into alphabetical order by name. Nor did you click on the "CPU" column which would have sorted the processes into descending order by CPU consumption (i.e. busiest process on top). If you do sort by the CPU usage column, the list will rearrange itself each second to have the "busiest" process always at the top, etc. So sorting by CPU usage is a VERY USEFUL PRESENTATION.

    Of course the display by CPU usage will change every second as time moves on, but at this moment when you took your screenshot it does not add up to 40%. So it's not obvious which task is responsible for your "spike". You have to wait and watch, until you see some process pop to the top and show a large CPU usage value, in order for the sum of these non-zero processes to even be close to the 40% you say this adds up to every so often.

    Nevertheless, looking at the current list almost all of the processes are 0%, with only three non-zero processes shown that add up to only 8%. So this is not a good screenshot from an informational perspective, as it's not sorted in a helpful way and it's also only showing 8% usage at this moment.


    Why are you posting these? Again you haven't spread the first "name" column, and there is no CPU or memory column for "processes". So what do you expect to learn from this display? I don't see any value in these.


    AHA! Finally, something of interest.

    You certainly have increases in CPU usage every so often, up to a max of 45% or so. Looks to be two such situations, about 30 seconds apart. I don't know about watching this for several minutes to see if that's the repeating pattern, but in the graph you've posted I certainly see significant CPU usage with about 10% being the "floor" minimum value. This sort of corresponds to your "process" screenshot that showed 8% in those three non-zero processes at that instant.

    So if you can watch your "processes" with it sorted into descending order on the CPU column, and then wait until you see that moment when you have a real "hog" at the top so that the total of the top few non-zero processes add up to about 45%, and THEN TAKE A SCREENSHOT, that is what we're looking for


    Also my specs are:
    GPU: GTX 650 Ti BOOST
    CPU: Intel i5 4670k
    Ram: 8gb (i dont know the brand)
    Your user profile "specs" for the forum is what i was asking you to update.

    Go to UserCP, then on the left click on "Edit System Spec" and fill it out, and SAVE.

    Anyway, I would say that you have a "strong" machine. So there must be something really using lots of CPU. It will be shown in the "processes" display, if you just sort it into descending CPU sequence and then "catch it" when the culprit(s) pop to the top and add up to 45%.

    Also, I'd like to see the "applications" tab of Task Manager, to see the programs running. It's a combination of "application programs" as well as "processes" that give a good picture of what's really active on your system.
      My Computer

  5.   My Computer


  6. Posts : 5
    Windows 7 Home Premium SP1 X64
    Thread Starter
       #6

    Also i noticed that my explorer.exe in my processes keeps on spiking in usage from CPU and memory
      My Computer


  7. Posts : 2,752
    Windows 7 Pro x64 (1), Win7 Pro X64 (2)
       #7

    Well, I'm puzzled.

    Your "applications" only show one Chrome running. But your "processes" show fourteen Chrome processes active. How many tabs do you have open in that one Chrome window?

    I use Firefox, and each separate window instance corresponds to an "application". But no matter how many Firefox windows are open, and no matter how many tabs are open in each window, there is only one single Firefox "process". Yes, as I open more and more windows, and more and more tabs, the memory utilized increases, but that's perfectly understandable. However there is only one single Firefox "process" that appears to handle everything for all windows and all tabs.

    Obviously there is a significant difference in design architecture between Chrome and Firefox.


    Second, the particular moment you chose to take your "processes" screenshot that shows total non-zero CPU usage of 34% includes your Gyazo screenshot uploader(?) taking 15%. That wouldn't normally be a contributor in your normal steady state I'm guessing, but you're using it right now just to take these screenshots. I'm not familiar with this product, but 15% does seem like an ENORMOUS amount of CPU (on your fast machine) for something as simple as taking a screenshot or just uploading it to a web site. This seems quite unexpected to me.

    Also, TASKMGR itself is showing 10%. Again, you're really only running this in order to show the details of what's going on. Again, you wouldn't normally be running TASKMGR in your normal steady state. However 10% for TASKMGR is an astonishingly high number. I myself at this moment (and I have a reasonable amount of programs running, and am using 50% of my own 8GB of memory) show TASKMGR using ZERO %. So for your system to show TASKMGR using 10% under any circumstances is again very unexpected to me.

    You also show Skype active, and using 2%. And you have Steam running.

    And what is that "McAfee installer", Arma 2 Operation Arrowhead?

    Can you please post a screenshot of your System Tray (notification area)... with "customize notification" set to "show all icons" so that everything running there is visible. This is interesting info to see.


    Ok. You show quite a number of active "applications".

    Just for the purpose of isolating which of these might actually be the "culprit", along with those other "processes" which run in the background, I'd like you to terminate pretty much everything except the monitoring tools we want to keep an eye on: (a) TASKMGR for "processes" and sorted into descending CPU, and (b) my PERFMON performance monitor that I gave you and that you still have running.

    So, please end everything you can. Close Chrome, Skype, Steam, whatever that McAfee installer is, whatever Arma 2 is, and whatever that WINRAR instance is that you're using to unzip something(?). End everything. And confirm with TASKMGR that there now are no applications running except my PERFORMANCE. Also, all of those Chrome tasks should now be ended as well.

    It also may be appropriate to end one or more of the background tasks running which appear in your System Tray, but until I see that screenshot I don't know if it's needed.

    Ok, with everything now closed, what does PERFMON look like? Is it "flat" down near the 0% CPU as one would expect? Or is it sill very high for nothing at all running?

    Then, one at a time you can restart your applications and watch PERFMON and TASKMGR. Do you see a sudden jump in CPU usage? If not, close that application again and now open a different one. I want you to investigate this one app at a time, until (hopefully) one of them reveals itself as a suspiciously conspicuous user of CPU.

    Get the idea? You need to use these tools cleverly, to try and isolate the things that are at the moment all running together and simultaneously, to instead run just one at a time. The graph from PERFMON will help, as will the rows at the top of the TASKMGR process list when sorted into descending CPU order.
      My Computer


  8. Posts : 2,752
    Windows 7 Pro x64 (1), Win7 Pro X64 (2)
       #8

    CapriSun said:
    Also i noticed that my explorer.exe in my processes keeps on spiking in usage from CPU and memory
    This is unexpected as well.

    I wonder if this is Windows Search Index or something else?

    Again, you need to terminate everything you've manually started, and also look at what's in the System Tray notification area and potentially stop that as well. It may be necessary to stop McAfee (which is a pretty "intrusive" anti-virus). We're trying to get to a state where you have essentially ZERO CPU usage.

    Now you one-at-a-time start things back up and watch the CPU. If it remains at ZERO, then this is not the culprit, so you can stop it and go on to the next one. The goal is to see if you can figure out which one or more of the things you're running is the "culprit".
      My Computer


  9. Posts : 5
    Windows 7 Home Premium SP1 X64
    Thread Starter
       #9

    dsperber said:
    CapriSun said:
    Also i noticed that my explorer.exe in my processes keeps on spiking in usage from CPU and memory
    Now you one-at-a-time start things back up and watch the CPU. If it remains at ZERO, then this is not the culprit, so you can stop it and go on to the next one. The goal is to see if you can figure out which one or more of the things you're running is the "culprit".

    Yeah, I did that and it seemed that when I loaded up one window of google chrome it would make my CPU spike. It also had around 10-11 processes with it...
      My Computer


  10. Posts : 25,847
    Windows 10 Pro. 64/ version 1709 Windows 7 Pro/64
       #10

    My self and many other members that want to try and help will not go off site to see your pictures.

    Please use this tutorial by Brink to post screen shots or pictures.

    Screenshots and Files - Upload and Post in Seven Forums
      My Computer


Page 1 of 2 12 LastLast

  Related Discussions
Our Sites
Site Links
About Us
Windows 7 Forums is an independent web site and has not been authorized, sponsored, or otherwise approved by Microsoft Corporation. "Windows 7" and related materials are trademarks of Microsoft Corp.

© Designer Media Ltd
All times are GMT -5. The time now is 19:12.
Find Us