Well, your issue is a hardware issue. But which part of the hardware is failing there is hard to determine. It is not available from the dump data. As you are asking for detail, let us try.
It is a stop 0x124 BSOD, attributed to hardware error.
Code:
*******************************************************************************
*                                                                             *
*                        Bugcheck Analysis                                    *
*                                                                             *
*******************************************************************************

Use !analyze -v to get detailed debugging information.

BugCheck 124, {0, fffffa8010071028, be200000, 21152}

Probably caused by : GenuineIntel

Followup: MachineOwner
---------
The first parameter says, it is a machine check exception.
Code:
WHEA_UNCORRECTABLE_ERROR (124)
A fatal hardware error has occurred. Parameter 1 identifies the type of error
source that reported the error. Parameter 2 holds the address of the
WHEA_ERROR_RECORD structure that describes the error conditon.
Arguments:
Arg1: 0000000000000000, Machine Check Exception
Arg2: fffffa8010071028, Address of the WHEA_ERROR_RECORD structure.
Arg3: 00000000be200000, High order 32-bits of the MCi_STATUS value.
Arg4: 0000000000021152, Low order 32-bits of the MCi_STATUS value.
That means, the CPU reported a crsh to the operating system. It may be a failing CPU, or any other hardware failure detected by CPU.
The stack shows a lot of Hardware Abstraction Layer (hal.dll) entry.
Code:
Child-SP          RetAddr           Call Site
fffff880`03575b58 fffff800`033f8a3b nt!KeBugCheckEx
fffff880`03575b60 fffff800`02f8c443 hal!HalBugCheckSystem+0x1e3
fffff880`03575ba0 fffff800`033f8700 nt!WheaReportHwError+0x263
fffff880`03575c00 fffff800`033f8052 hal!HalpMcaReportError+0x4c
fffff880`03575d50 fffff800`033f7f0d hal!HalpMceHandler+0x9e
fffff880`03575d90 fffff800`033ebe88 hal!HalpMceHandlerWithRendezvous+0x55
fffff880`03575dc0 fffff800`02e744ec hal!HalHandleMcheck+0x40
fffff880`03575df0 fffff800`02e74353 nt!KxMcheckAbort+0x6c
fffff880`03575f30 fffff800`03168735 nt!KiMcheckAbort+0x153
fffff880`0aac1ca0 00000000`00000000 nt!PspGetContextThreadInternal+0x95
So, we have to search for the reason of the BSOD in our hardware. Let us start testing?
Are you overclocking?
Code:
CPUID:        "Intel(R) Core(TM) i7-3770K CPU @ 3.50GHz"
MaxSpeed:     3500
CurrentSpeed: 3510
As you are getting BSODs, you should stop overclocking and run all the hardware components like CPU, GPU and RAM to their default settings. Also set the BIOS to default, too.
How To Clear CMOS (Reset BIOS)
Test your RAM modules for possible errors.
How to Test and Diagnose RAM Issues with Memtest86+
Run memtest for at least 8 passes, preferably overnight.
Stress test the Graphics Card using Furmark.
Video Card - Stress Test with Furmark
Stress test the CPU.
Hardware - Stress Test With Prime95
Is the computer hot? Report us the heat of the computer after a couple of hours of your normal usage. Upload a screenshot of the summery tab of
Speccy.
Check if the Power Supply Unit (PSU) supplying adequate power to the computer or not.
eXtreme Power Supply Calculator
At least 30% extra is safe.
Do some Disc checks.
- Update your Samsung 840 Series SSD's Firmware
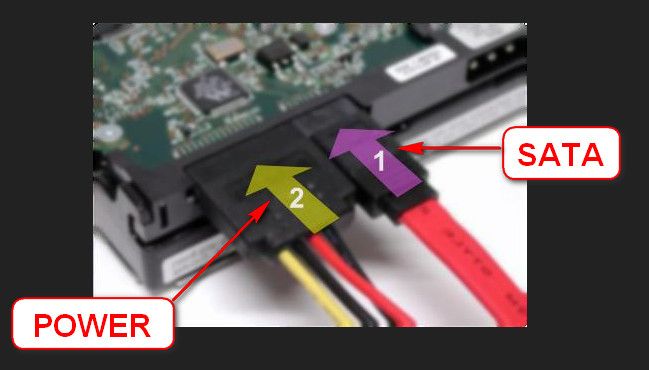
- Re-seat the sata and power.
- Run chkdsk /f/r, following the option two of the tutorial Disk Check
- Seatool for dos: SeaTools | Seagate download
Burn it in a blank cd. boot from the CD, click on "Accept", wait for it to finish detecting the drives, then in the upper left corner select "Basic Tests", then select "Long Test" and let it run.
(3 and 4 are for the 1TB seagate only)
Let us know the results.
__________________________________________________________________________________
BSOD ANALYSIS:
Code:
*******************************************************************************
*                                                                             *
*                        Bugcheck Analysis                                    *
*                                                                             *
*******************************************************************************

Use !analyze -v to get detailed debugging information.

BugCheck 124, {0, fffffa8010071028, be200000, 21152}

Probably caused by : GenuineIntel

Followup: MachineOwner
---------

7: kd> !analyze -v
*******************************************************************************
*                                                                             *
*                        Bugcheck Analysis                                    *
*                                                                             *
*******************************************************************************

WHEA_UNCORRECTABLE_ERROR (124)
A fatal hardware error has occurred. Parameter 1 identifies the type of error
source that reported the error. Parameter 2 holds the address of the
WHEA_ERROR_RECORD structure that describes the error conditon.
Arguments:
Arg1: 0000000000000000, Machine Check Exception
Arg2: fffffa8010071028, Address of the WHEA_ERROR_RECORD structure.
Arg3: 00000000be200000, High order 32-bits of the MCi_STATUS value.
Arg4: 0000000000021152, Low order 32-bits of the MCi_STATUS value.

Debugging Details:
------------------


BUGCHECK_STR:  0x124_GenuineIntel

CUSTOMER_CRASH_COUNT:  1

DEFAULT_BUCKET_ID:  WIN7_DRIVER_FAULT

PROCESS_NAME:  explorer.exe

CURRENT_IRQL:  f

STACK_TEXT:
fffff880`03575b58 fffff800`033f8a3b : 00000000`00000124 00000000`00000000 fffffa80`10071028 00000000`be200000 : nt!KeBugCheckEx
fffff880`03575b60 fffff800`02f8c443 : 00000000`00000001 fffffa80`1002c770 00000000`00000000 fffffa80`1002c7c0 : hal!HalBugCheckSystem+0x1e3
fffff880`03575ba0 fffff800`033f8700 : 00000000`00000728 fffffa80`1002c770 fffff880`03575f30 fffff880`03575f00 : nt!WheaReportHwError+0x263
fffff880`03575c00 fffff800`033f8052 : fffffa80`1002c770 fffff880`03575f30 fffffa80`1002c770 00000000`00000000 : hal!HalpMcaReportError+0x4c
fffff880`03575d50 fffff800`033f7f0d : 00000000`00000008 00000000`00000001 fffff880`03575fb0 00000000`00000000 : hal!HalpMceHandler+0x9e
fffff880`03575d90 fffff800`033ebe88 : fffff880`0aac2460 00000000`00000000 00000000`00000000 00000000`00000000 : hal!HalpMceHandlerWithRendezvous+0x55
fffff880`03575dc0 fffff800`02e744ec : 00000000`00000000 00000000`00000000 00000000`00000000 00000000`00000000 : hal!HalHandleMcheck+0x40
fffff880`03575df0 fffff800`02e74353 : 00000000`00000000 00000000`00000000 00000000`00000000 00000000`00000000 : nt!KxMcheckAbort+0x6c
fffff880`03575f30 fffff800`03168735 : 00000000`00000000 00000000`00000000 00000000`00000000 00000000`00000000 : nt!KiMcheckAbort+0x153
fffff880`0aac1ca0 00000000`00000000 : 00000000`00000000 00000000`00000000 00000000`00000000 00000000`00000000 : nt!PspGetContextThreadInternal+0x95


STACK_COMMAND:  kb

FOLLOWUP_NAME:  MachineOwner

MODULE_NAME: GenuineIntel

IMAGE_NAME:  GenuineIntel

DEBUG_FLR_IMAGE_TIMESTAMP:  0

FAILURE_BUCKET_ID:  X64_0x124_GenuineIntel_PROCESSOR_CACHE

BUCKET_ID:  X64_0x124_GenuineIntel_PROCESSOR_CACHE

Followup: MachineOwner
---------


 Quote
Quote