I have all the drivers up to date.
type cmd in search>right click and run as admin>sfc /scannow Done..everything is ok here...
thx in advance.
anyone can help me??
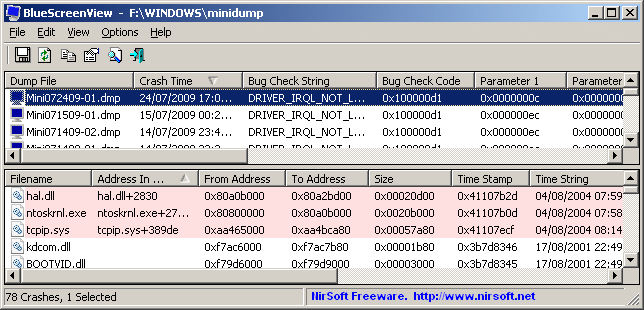
here is a screenshot with Bluescreen Viewer.


this one caused by intelppm.sys. that driver is either bios (mobo) or another intell driver need to find and update
Ken J+
Loading Dump File [C:\Users\K\Desktop\1.minidump\New folder\123009-20935-01.dmp]
Mini Kernel Dump File: Only registers and stack trace are available
Symbol search path is: SRV*d:\symbols*
Symbol information
Executable search path is:
Windows 7 Kernel Version 7600 MP (2 procs) Free x64
Product: WinNt, suite: TerminalServer SingleUserTS
Built by: 7600.16385.amd64fre.win7_rtm.090713-1255
Machine Name:
Kernel base = 0xfffff800`02e4e000 PsLoadedModuleList = 0xfffff800`0308be50
Debug session time: Wed Dec 30 15:58:30.592 2009 (GMT-5)
System Uptime: 0 days 6:48:22.262
Loading Kernel Symbols
...............................................................
................................................................
.................
Loading User Symbols
Loading unloaded module list
.......
*******************************************************************************
* *
* Bugcheck Analysis *
* *
*******************************************************************************
Use !analyze -v to get detailed debugging information.
BugCheck D1, {c0, 2, 0, c0}
Probably caused by : intelppm.sys ( intelppm!C1Halt+2 )
Followup: MachineOwner
---------
0: kd> !analyze -v
*******************************************************************************
* *
* Bugcheck Analysis *
* *
*******************************************************************************
DRIVER_IRQL_NOT_LESS_OR_EQUAL (d1)
An attempt was made to access a pageable (or completely invalid) address at an
interrupt request level (IRQL) that is too high. This is usually
caused by drivers using improper addresses.
If kernel debugger is available get stack backtrace.
Arguments:
Arg1: 00000000000000c0, memory referenced
Arg2: 0000000000000002, IRQL
Arg3: 0000000000000000, value 0 = read operation, 1 = write operation
Arg4: 00000000000000c0, address which referenced memory
Debugging Details:
------------------
READ_ADDRESS: GetPointerFromAddress: unable to read from fffff800030f60e0
00000000000000c0
CURRENT_IRQL: 2
FAULTING_IP:
+5977952f0587df44
00000000`000000c0 ?? ???
PROCESS_NAME: System
CUSTOMER_CRASH_COUNT: 1
DEFAULT_BUCKET_ID: VISTA_DRIVER_FAULT
BUGCHECK_STR: 0xD1
TRAP_FRAME: fffff80004552a60 -- (.trap 0xfffff80004552a60)
NOTE: The trap frame does not contain all registers.
Some register values may be zeroed or incorrect.
rax=fffffa80036ea4a0 rbx=0000000000000000 rcx=fffff8000303bd48
rdx=0000000000000056 rsi=0000000000000000 rdi=0000000000000000
rip=00000000000000c0 rsp=fffff80004552bf0 rbp=000000000017f756
r8=fffffa80036ea480 r9=00000000000000c1 r10=0000000000000056
r11=0000000000000000 r12=0000000000000000 r13=0000000000000000
r14=0000000000000000 r15=0000000000000000
iopl=0 nv up ei pl nz na pe nc
00000000`000000c0 ?? ???
Resetting default scope
LAST_CONTROL_TRANSFER: from fffff80002ebf469 to fffff80002ebff00
FAILED_INSTRUCTION_ADDRESS:
+5977952f0587df44
00000000`000000c0 ?? ???
STACK_TEXT:
fffff800`04552918 fffff800`02ebf469 : 00000000`0000000a 00000000`000000c0 00000000`00000002 00000000`00000000 : nt!KeBugCheckEx
fffff800`04552920 fffff800`02ebe0e0 : 00000000`00000000 00000039`0c7c82b6 fffffa80`03c9d500 fffffa80`03caf530 : nt!KiBugCheckDispatch+0x69
fffff800`04552a60 00000000`000000c0 : 00000039`0c7a2156 fffff800`04552c18 00000000`0017f756 fffff800`0303bd48 : nt!KiPageFault+0x260
fffff800`04552bf0 00000039`0c7a2156 : fffff800`04552c18 00000000`0017f756 fffff800`0303bd48 fffff800`03038e80 : 0xc0
fffff800`04552bf8 fffff800`04552c18 : 00000000`0017f756 fffff800`0303bd48 fffff800`03038e80 01ca8992`d76c7d42 : 0x39`0c7a2156
fffff800`04552c00 00000000`0017f756 : fffff800`0303bd48 fffff800`03038e80 01ca8992`d76c7d42 00000000`81000000 : 0xfffff800`04552c18
fffff800`04552c08 fffff800`0303bd48 : fffff800`03038e80 01ca8992`d76c7d42 00000000`81000000 fffff880`0439e9c2 : 0x17f756
fffff800`04552c10 fffff800`03038e80 : 01ca8992`d76c7d42 00000000`81000000 fffff880`0439e9c2 00000000`00000010 : nt!KiInitialPCR+0x3048
fffff800`04552c18 01ca8992`d76c7d42 : 00000000`81000000 fffff880`0439e9c2 00000000`00000010 00000000`00000246 : nt!KiInitialPCR+0x180
fffff800`04552c20 00000000`81000000 : fffff880`0439e9c2 00000000`00000010 00000000`00000246 fffff800`04552c58 : 0x1ca8992`d76c7d42
fffff800`04552c28 fffff880`0439e9c2 : 00000000`00000010 00000000`00000246 fffff800`04552c58 fffff800`0454c080 : 0x81000000
fffff800`04552c30 00000000`00000010 : 00000000`00000246 fffff800`04552c58 fffff800`0454c080 00000000`00000008 : intelppm!C1Halt+0x2
fffff800`04552c38 00000000`00000246 : fffff800`04552c58 fffff800`0454c080 00000000`00000008 00000000`00000000 : 0x10
fffff800`04552c40 fffff800`04552c58 : fffff800`0454c080 00000000`00000008 00000000`00000000 00000000`ffffffed : 0x246
fffff800`04552c48 fffff800`0454c080 : 00000000`00000008 00000000`00000000 00000000`ffffffed 00003a33`c128a124 : 0xfffff800`04552c58
fffff800`04552c50 00000000`00000008 : 00000000`00000000 00000000`ffffffed 00003a33`c128a124 fffff800`03046c40 : 0xfffff800`0454c080
fffff800`04552c58 00000000`00000000 : 00000000`ffffffed 00003a33`c128a124 fffff800`03046c40 00000000`00000001 : 0x8
STACK_COMMAND: kb
FOLLOWUP_IP:
intelppm!C1Halt+2
fffff880`0439e9c2 c3 ret
SYMBOL_STACK_INDEX: b
SYMBOL_NAME: intelppm!C1Halt+2
FOLLOWUP_NAME: MachineOwner
MODULE_NAME: intelppm
IMAGE_NAME: intelppm.sys
DEBUG_FLR_IMAGE_TIMESTAMP: 4a5bc0fd
FAILURE_BUCKET_ID: X64_0xD1_CODE_AV_BAD_IP_intelppm!C1Halt+2
BUCKET_ID: X64_0xD1_CODE_AV_BAD_IP_intelppm!C1Halt+2
Followup: MachineOwner
---------
0: kd> !analyse -v
No export analyse found