Hi everyone!
Recently out of the blue I started having weird sound pops and crackling and through a bit of Googling I found out that high latency is the problem.
Using LatencyMon I noticed that ndis.sys and tcpip.sys are the main culprits. The issue gets worse the longer the system is running. Disabling network adapters or unplugging the Ethernet cable imminently fixes the issue. Here are the fixes I have attempted so far:
- Installed latest Windows updates
- Installed latest sound drivers
- Installed latest graphics drivers
- Installed latest network adapter drivers
- Bought a new network adapter (TP-Link TG-3468) - did not improve anything
- Did multiple scans for malware with no results
- Cleaned and repaired registry keys
- Changed Power Options to High Performance
- Turned Energy Efficient Ethernet off
- Tried disabling Antivirus and Firewall
So far nothing has improved the situation. Here's the report from LatencyMon:
I'm kind of running of ideas of what to do that's I'm turning to you guys. Any help will be greatly appreciated! Thanks!
Recently out of the blue I started having weird sound pops and crackling and through a bit of Googling I found out that high latency is the problem.
Using LatencyMon I noticed that ndis.sys and tcpip.sys are the main culprits. The issue gets worse the longer the system is running. Disabling network adapters or unplugging the Ethernet cable imminently fixes the issue. Here are the fixes I have attempted so far:
- Installed latest Windows updates
- Installed latest sound drivers
- Installed latest graphics drivers
- Installed latest network adapter drivers
- Bought a new network adapter (TP-Link TG-3468) - did not improve anything
- Did multiple scans for malware with no results
- Cleaned and repaired registry keys
- Changed Power Options to High Performance
- Turned Energy Efficient Ethernet off
- Tried disabling Antivirus and Firewall
So far nothing has improved the situation. Here's the report from LatencyMon:
CONCLUSION
_________________________________________________________________________________________________________
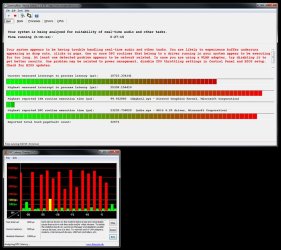
Your system appears to be having trouble handling real-time audio and other tasks. You are likely to experience buffer underruns appearing as drop outs, clicks or pops. One or more DPC routines that belong to a driver running in your system appear to be executing for too long. At least one detected problem appears to be network related. In case you are using a WLAN adapter, try disabling it to get better results. One problem may be related to power management, disable CPU throttling settings in Control Panel and BIOS setup. Check for BIOS updates.
LatencyMon has been analyzing your system for 0:27:42 (h:mm:ss) on all processors.
_________________________________________________________________________________________________________
SYSTEM INFORMATION
_________________________________________________________________________________________________________
OS version: Windows 7 Service Pack 1, 6.1, build: 7601 (x64)
Hardware: ASUSTeK COMPUTER INC., RAMPAGE IV EXTREME
CPU: GenuineIntel Intel(R) Core(TM) i7-3930K CPU @ 3.20GHz
Logical processors: 12
Processor groups: 1
RAM: 32708 MB total
_________________________________________________________________________________________________________
CPU SPEED
_________________________________________________________________________________________________________
Reported CPU speed: 3201 MHz
Note: reported execution times may be calculated based on a fixed reported CPU speed. Disable variable speed settings like Intel Speed Step and AMD Cool N Quiet in the BIOS setup for more accurate results.
WARNING: the CPU speed that was measured is only a fraction of the CPU speed reported. Your CPUs may be throttled back due to variable speed settings and thermal issues. It is suggested that you run a utility which reports your actual CPU frequency and temperature.
_________________________________________________________________________________________________________
MEASURED INTERRUPT TO USER PROCESS LATENCIES
_________________________________________________________________________________________________________
The interrupt to process latency reflects the measured interval that a usermode process needed to respond to a hardware request from the moment the interrupt service routine started execution. This includes the scheduling and execution of a DPC routine, the signaling of an event and the waking up of a usermode thread from an idle wait state in response to that event.
Highest measured interrupt to process latency (µs): 25338.154410
Average measured interrupt to process latency (µs): 7.197709
Highest measured interrupt to DPC latency (µs): 18108.778678
Average measured interrupt to DPC latency (µs): 2.314774
_________________________________________________________________________________________________________
REPORTED ISRs
_________________________________________________________________________________________________________
Interrupt service routines are routines installed by the OS and device drivers that execute in response to a hardware interrupt signal.
Highest ISR routine execution time (µs): 100.373008
Driver with highest ISR routine execution time: dxgkrnl.sys - DirectX Graphics Kernel, Microsoft Corporation
Highest reported total ISR routine time (%): 0.004435
Driver with highest ISR total time: hal.dll - Hardware Abstraction Layer DLL, Microsoft Corporation
Total time spent in ISRs (%) 0.009334
ISR count (execution time <250 µs): 1323672
ISR count (execution time 250-500 µs): 0
ISR count (execution time 500-999 µs): 0
ISR count (execution time 1000-1999 µs): 0
ISR count (execution time 2000-3999 µs): 0
ISR count (execution time >=4000 µs): 0
_________________________________________________________________________________________________________
REPORTED DPCs
_________________________________________________________________________________________________________
DPC routines are part of the interrupt servicing dispatch mechanism and disable the possibility for a process to utilize the CPU while it is interrupted until the DPC has finished execution.
Highest DPC routine execution time (µs): 23235.736020
Driver with highest DPC routine execution time: ndis.sys - NDIS 6.20 driver, Microsoft Corporation
Highest reported total DPC routine time (%): 0.016084
Driver with highest DPC total execution time: rspLLL64.sys - Resplendence Latency Monitoring and Auxiliary Kernel Library, Resplendence Software Projects Sp.
Total time spent in DPCs (%) 0.046159
DPC count (execution time <250 µs): 7113470
DPC count (execution time 250-500 µs): 0
DPC count (execution time 500-999 µs): 130
DPC count (execution time 1000-1999 µs): 111
DPC count (execution time 2000-3999 µs): 26
DPC count (execution time >=4000 µs): 0
_________________________________________________________________________________________________________
REPORTED HARD PAGEFAULTS
_________________________________________________________________________________________________________
Hard pagefaults are events that get triggered by making use of virtual memory that is not resident in RAM but backed by a memory mapped file on disk. The process of resolving the hard pagefault requires reading in the memory from disk while the process is interrupted and blocked from execution.
NOTE: some processes were hit by hard pagefaults. If these were programs producing audio, they are likely to interrupt the audio stream resulting in dropouts, clicks and pops. Check the Processes tab to see which programs were hit.
Process with highest pagefault count: photoshop.exe
Total number of hard pagefaults 32720
Hard pagefault count of hardest hit process: 10819
Number of processes hit: 38
_________________________________________________________________________________________________________
PER CPU DATA
_________________________________________________________________________________________________________
CPU 0 Interrupt cycle time (s): 19.459322
CPU 0 ISR highest execution time (µs): 58.032802
CPU 0 ISR total execution time (s): 0.885138
CPU 0 ISR count: 1229081
CPU 0 DPC highest execution time (µs): 10689.585130
CPU 0 DPC total execution time (s): 5.371165
CPU 0 DPC count: 6473649
_________________________________________________________________________________________________________
CPU 1 Interrupt cycle time (s): 9.824003
CPU 1 ISR highest execution time (µs): 0.0
CPU 1 ISR total execution time (s): 0.0
CPU 1 ISR count: 0
CPU 1 DPC highest execution time (µs): 58.967510
CPU 1 DPC total execution time (s): 0.003252
CPU 1 DPC count: 1465
_________________________________________________________________________________________________________
CPU 2 Interrupt cycle time (s): 12.194269
CPU 2 ISR highest execution time (µs): 22.859419
CPU 2 ISR total execution time (s): 0.021645
CPU 2 ISR count: 4256
CPU 2 DPC highest execution time (µs): 3816.433614
CPU 2 DPC total execution time (s): 0.372362
CPU 2 DPC count: 103528
_________________________________________________________________________________________________________
CPU 3 Interrupt cycle time (s): 11.248519
CPU 3 ISR highest execution time (µs): 0.0
CPU 3 ISR total execution time (s): 0.0
CPU 3 ISR count: 0
CPU 3 DPC highest execution time (µs): 1433.348329
CPU 3 DPC total execution time (s): 0.006147
CPU 3 DPC count: 1119
_________________________________________________________________________________________________________
CPU 4 Interrupt cycle time (s): 12.836927
CPU 4 ISR highest execution time (µs): 0.0
CPU 4 ISR total execution time (s): 0.0
CPU 4 ISR count: 0
CPU 4 DPC highest execution time (µs): 5750.657607
CPU 4 DPC total execution time (s): 0.289653
CPU 4 DPC count: 37084
_________________________________________________________________________________________________________
CPU 5 Interrupt cycle time (s): 11.070328
CPU 5 ISR highest execution time (µs): 0.0
CPU 5 ISR total execution time (s): 0.0
CPU 5 ISR count: 0
CPU 5 DPC highest execution time (µs): 1052.802249
CPU 5 DPC total execution time (s): 0.005042
CPU 5 DPC count: 1332
_________________________________________________________________________________________________________
CPU 6 Interrupt cycle time (s): 19.639440
CPU 6 ISR highest execution time (µs): 33.263043
CPU 6 ISR total execution time (s): 0.257152
CPU 6 ISR count: 59460
CPU 6 DPC highest execution time (µs): 23235.736020
CPU 6 DPC total execution time (s): 2.593849
CPU 6 DPC count: 379263
_________________________________________________________________________________________________________
CPU 7 Interrupt cycle time (s): 11.102153
CPU 7 ISR highest execution time (µs): 0.0
CPU 7 ISR total execution time (s): 0.0
CPU 7 ISR count: 0
CPU 7 DPC highest execution time (µs): 153.982505
CPU 7 DPC total execution time (s): 0.007355
CPU 7 DPC count: 2436
_________________________________________________________________________________________________________
CPU 8 Interrupt cycle time (s): 11.539681
CPU 8 ISR highest execution time (µs): 0.0
CPU 8 ISR total execution time (s): 0.0
CPU 8 ISR count: 0
CPU 8 DPC highest execution time (µs): 1702.593565
CPU 8 DPC total execution time (s): 0.075667
CPU 8 DPC count: 25596
_________________________________________________________________________________________________________
CPU 9 Interrupt cycle time (s): 21.887723
CPU 9 ISR highest execution time (µs): 100.373008
CPU 9 ISR total execution time (s): 0.698179
CPU 9 ISR count: 30765
CPU 9 DPC highest execution time (µs): 1098.108716
CPU 9 DPC total execution time (s): 0.400809
CPU 9 DPC count: 67224
_________________________________________________________________________________________________________
CPU 10 Interrupt cycle time (s): 9.959353
CPU 10 ISR highest execution time (µs): 8.757263
CPU 10 ISR total execution time (s): 0.000495
CPU 10 ISR count: 110
CPU 10 DPC highest execution time (µs): 41.340519
CPU 10 DPC total execution time (s): 0.005152
CPU 10 DPC count: 689
_________________________________________________________________________________________________________
CPU 11 Interrupt cycle time (s): 13.989729
CPU 11 ISR highest execution time (µs): 0.0
CPU 11 ISR total execution time (s): 0.0
CPU 11 ISR count: 0
CPU 11 DPC highest execution time (µs): 1265.708529
CPU 11 DPC total execution time (s): 0.080941
CPU 11 DPC count: 20367
_________________________________________________________________________________________________________
I'm kind of running of ideas of what to do that's I'm turning to you guys. Any help will be greatly appreciated! Thanks!
Attachments
My Computer
At a glance
Windows 7 Ultimate x64Inel i7-3930K 3.20GHz32GBASUS ROG Strix GeForce STRIX-GTX1080-A8G
- Computer type
- PC/Desktop
- OS
- Windows 7 Ultimate x64
- CPU
- Inel i7-3930K 3.20GHz
- Motherboard
- Asus Rampage IV Extreme
- Memory
- 32GB
- Graphics Card(s)
- ASUS ROG Strix GeForce STRIX-GTX1080-A8G
- Antivirus
- ZoneAlarm
- Browser
- Chrome