Configuring the "Debugging Tools"

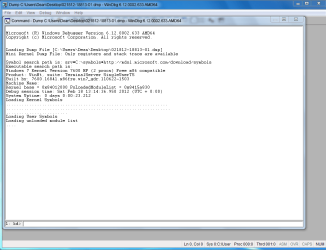
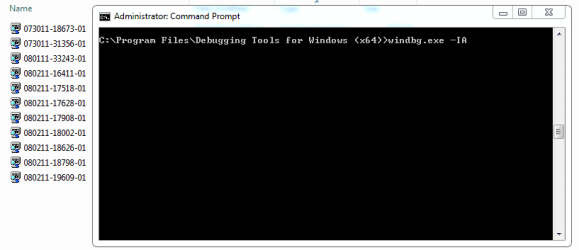
Thank you for this tutorial. When I tried to set up the file association (3rd step) it told me I don't have administrator privileges to do it. It also won't let me mess with the dump files in the folder. I copied one to the desktop and zipped it there, also opened it in windbg. There's no other administrator. Thanks
 

My Computer

OS
Windows 7 64 bit
CPU
Intel Core i7 920 @ 2.67GHz
Motherboard
MSI X58 Platinum
Memory
6GB PC3 12800
Graphics Card(s)
2@ NVIDIA GeForce GTS 250
Monitor(s) Displays
4@Acer P201w
Hard Drives
128GB Corsair solid state drive
1TB Western Digital @7200
PSU
Silencer 750W
Case
Cooler Master 932 HAF full tower
Cooling
Corsair H50 Water cooler, lots of fans
Admin problems with minidump

Thanks Geo64 and zigzag! Got it to work!

For any noobs who follow:
1. Open a command prompt as an admin, that'll give you:
"C:\Windows\system32>"

2. Enter "chdir /d C:\debuggers"... this will give you a new prompt "C:\debuggers"

3. Enter "windbg.exe -IA" and Et Voila!

Thanks again guys! :D

I'm tracking this as a noob and have only one obstacle: it doesn't like me opening files in the minidump folder. I can copy and paste them to the desktop and open them there, but it gives me grief from the minidump folder--which has a lock icon on it. How do I set this straight? Thanks
 

My Computer

OS
Windows 7 64 bit
CPU
Intel Core i7 920 @ 2.67GHz
Motherboard
MSI X58 Platinum
Memory
6GB PC3 12800
Graphics Card(s)
2@ NVIDIA GeForce GTS 250
Monitor(s) Displays
4@Acer P201w
Hard Drives
128GB Corsair solid state drive
1TB Western Digital @7200
PSU
Silencer 750W
Case
Cooler Master 932 HAF full tower
Cooling
Corsair H50 Water cooler, lots of fans
I'm tracking this as a noob and have only one obstacle: it doesn't like me opening files in the minidump folder. I can copy and paste them to the desktop and open them there, but it gives me grief from the minidump folder--which has a lock icon on it. How do I set this straight? Thanks

Sounds like a permissions problem. Try this Take Ownership tutorial and see if it fixes the problem.
 

My Computer

Computer Manufacturer/Model Number
me / #1
OS
windows 7 x64 Home Premium
CPU
intel q6600
Motherboard
gigbyte ga ep45 ud3l
Memory
g.skill 8gb ddr2 1066 (pc2 8500)
Graphics Card(s)
evga geforce 9800 gtx 512 mb
Screen Resolution
1680 x 1050
Hard Drives
wd caviar black 500 gb
wd caviar black 1tb
wd elements 1tb external hd x2
PSU
raidmax 500w
Case
smilodon (yes, t'was the pretty blue lites that got me!)
that is really helpful.
I am using BlueScreenView on my win 7 64 bit and i will switch to windows debugger.


thanks alot.
 

My Computer

Computer Manufacturer/Model Number
Home built PC
OS
windows 7
CPU
Intel Core i7 920 2.66 GHz
Motherboard
Gigabyte X58A-UD7
Memory
12288 MBytes
Graphics Card(s)
RADEON HD 5850
Monitor(s) Displays
2 SAMSUNGSyncMaster T260HD
Screen Resolution
1920X1200
Hard Drives
2T WDC
PSU
Thermaltake Key 3
Case
Thermaltake Spedo
Cooling
Noctua D14
Keyboard
Logitech dinovo SetPoint
Mouse
Logitech dinovo SetPoint
Internet Speed
1Mbps
You can also run BlueScreenView at an elevated admin level - RIGHT-click on icon, select "Run as Admin"
 

My Computer

OS
Windows 7 - Vista
First, thank you guys for the work you did to put this particular page together and to continue its development. It helped me figure out my problem and resolution.

While investigating a fix to my own issue with the recommendation above, I came across a nice tool to compliment and confirm this one. It came from the following website, Blue screen of death (STOP error) information in dump files., from NirSoft, and is totally free. It helps analyze (analyse) MiniDump files.

It, just like the one in the MS WDK package, breaks down the analysis of the BSOD Memory MiniDumps, and while not creating the huge and detailed analysis of the MS tool, it creates a very succinct one and highlights the probable cause very nicely. And, does so in microseconds. It is a very simple process and extremely easy to use. I highly recommend it too.

My compliments to all you guys that contribute heavily in this forum, you make it great to know that there are great people willing to help for nothing more than the satisfaction of helping! Thank you mush!
 

My Computer

Computer Manufacturer/Model Number
HP Pavilion DV7 laptop
OS
Windows 7 Home Premium x64
CPU
Intel Core i7 Q720
Memory
6GB
Graphics Card(s)
VIDIA GeForce GT230M 1GB
Sound Card
NVIDIA High Definition Audio
Monitor(s) Displays
Laptop screen
Screen Resolution
1600x900
Hard Drives
1TB
First, thank you guys for the work you did to put this particular page together and to continue its development. It helped me figure out my problem and resolution.

While investigating a fix to my own issue with the recommendation above, I came across a nice tool to compliment and confirm this one. It came from the following website, Blue screen of death (STOP error) information in dump files., from NirSoft, and is totally free. It helps analyze (analyse) MiniDump files.

It, just like the one in the MS WDK package, breaks down the analysis of the BSOD Memory MiniDumps, and while not creating the huge and detailed analysis of the MS tool, it creates a very succinct one and highlights the probable cause very nicely. And, does so in microseconds. It is a very simple process and extremely easy to use. I highly recommend it too.

My compliments to all you guys that contribute heavily in this forum, you make it great to know that there are great people willing to help for nothing more than the satisfaction of helping! Thank you mush!


The app from NirSoft = BlueScreenView, as mentioned by others

jcgriff2

.
 

My Computer

OS
Windows 7 - Vista
Guys has the tut changed... as its 2 years old... or can we still use the above method to still debug?

Thanks
 

My Computer

Computer Manufacturer/Model Number
Dell
OS
Windows 7 32bit
CPU
i5
Memory
2GB
Guys has the tut changed... as its 2 years old... or can we still use the above method to still debug?

Thanks

Yes it still works :)
 

My Computer

Computer type
PC/Desktop
Computer Manufacturer/Model Number
Custom Build
OS
Windows 10 Pro x64, Arch Linux
CPU
Intel Core 2 Quad Q8200 OC'd 3.08GHz
Motherboard
Asus Rampage formula LGA775
Memory
8GB DDR2 900Mhz
Graphics Card(s)
MSI GT730 2GB GDDR5 (Kepler)
Sound Card
Supreme FX2
Monitor(s) Displays
Samsung LS22F350 LED
Screen Resolution
1080P
Hard Drives
Kingston SSDNow UV400 120GB, 500GB Hitachi, 2TB Samsung, 500GB Seagate FreeAgent, 640GB Samsung, 160GB Toshiba (Arch)
PSU
AeroCool 500W Bronze
Cooling
Cooler Master V6 + 3X fans
Keyboard
Prolink keyboard
Mouse
Logitech M705
Internet Speed
1MiB/s
Browser
Chrome Beta
WinDBG as the default handler for dump files....

This may help.

My windbg is installed in C:\Program Files\Debugging Tools for Windows (x64)

So for me worked that simple command.....
 

Attachments

  • panais.PNG
    panais.PNG
    26.5 KB · Views: 82

My Computer

Computer Manufacturer/Model Number
Custom Built by me.
OS
Windows 7 Ultimate 64bit SP1
CPU
Intel Core 2 Quad Q6600
Motherboard
Gigabyte GA-X38-DS4
Memory
2X2GB DDR2 PC6400 800MHZ DUAL CHANNEL
Graphics Card(s)
XFX RADEON HD 6850 1GB GDDR5
Sound Card
2/4/5.1/7.1-channel Realtek High Definition
Monitor(s) Displays
Samsung LE40A656F1 1080p 100Hz LCD HD TV 50,000:1
Screen Resolution
1366x768 in Desktop,1920x1080p in gaming and video
Hard Drives
C:\WD VelociRaptor 150 GB,10,000 RPM
E:\WESTERN DIGITAL WD15EADS 1.5TB CAVIAR GREEN SATA2 F:\WESTERN DIGITAL WD15EADS 1.5TB CAVIAR GREEN SATA2
PSU
THERMALTAKE W0229 TOUGHPOWER XT 750W
Case
A-Case Twin Engine BB
Cooling
3 x thermaltake smart case fan II + 1 arctic cooling fan
Keyboard
Wireless Logitech LX710
Mouse
Logitech Wireless Gaming Mouse G700
Internet Speed
ADSL 12000 plus
Other Info
Mouse Logitech G700,with 13 buttons who needs keyboard in RPG?

D:\Sony high speed sata Dvd Rewriter
Logitech Cordless Rumblepad 2
Don't know if the OP is still active due to date - however

Excellent tuorial

I spent a couple of hours with BSOD expert zigzag yesterday (thankyou sir)
trying to figure some of this stuff out over an IM session.

Once again I should have taken some of my own advice and come straight to the tutorials
section and I would have saved zigzag and myself somewhere in the vicinity of an hour plus we would probably both have a lot more hair!

I am about to read through every other thing I can find here at the forums in this section and
in particular, how to find information on how to decisively solve reported errors and critical events
from event viewer logs. I have worked a couple of these out in the past however I usually find it very
difficult to find specific problem related information.

Anyway - great work H2S04 - two thumbs up
 

My Computer

OS
Windows 7 Home Premium 64 Bit OS
Hi All

I am trying to install the debugger package as described in this article.
From following the instructions as set out, it takes me to this page here >> Download and Install Debugging Tools for Windows

From here I see the following options for Windows 7;

Developing for Windows 8 or Windows 7
You can install the Debugging Tools Developer Preview as part of the Windows Driver Kit Developer Preview.
Download Debugging Tools with the Windows Driver Kit Developer Preview
->> MSDN subscription and sign in required
Release Notes: Debugging Tools for Windows Developer Preview
It now appears I need a MDSN subsciption to download the debug tools! Has it now been withdrawn from the general public?
 
Last edited:

My Computer

Computer Manufacturer/Model Number
Custom - PC Specialist
OS
Windows 7/Linux
CPU
Athlon 64 x2 6000+
Motherboard
ASUS M3N78 PRO
Memory
4Gb Dual Channel
Graphics Card(s)
Geforce 8400
Sound Card
On Board
Monitor(s) Displays
BenQ G2222HDL
Screen Resolution
1920x1080
Hard Drives
1Gb Spinpoint F3/740Gb Western Digital
640Gb Western Digital
PSU
National Grid
Case
Yes
Cooling
Stock Cooler
Keyboard
Saitek Eclipse II
Mouse
Microsoft Laser Mouse
Internet Speed
50Mb
Guys has the tut changed... as its 2 years old... or can we still use the above method to still debug?

Thanks
It still works. I just installed all of the Common Utilities including the Debugging Tools. However, since it is 2 years later, even though I installed as per the tutorial's instructions for a shorter program path, the SDK v7.1 installed it anyway into its default location:
"C:\Program Files\Debugging Tools for Windows (x64)\windbg.exe"

I now have the SDK v7.1 installed in 2 locations, its default above and also on my D: partition. The D: partition only has 2.5 MB's and the default above has about 41 MB's and probably about 255 MB's somewhere else on the C: O/S partition. I recommend you disregard the older tutorial's instructions regarding program location installation and simply use the default location now. This way everything is together. However, I also followed the tutorial's instructions regarding a separate Symbols folder and it already has 65 MB's so continue following that.

Many thanks to H2SO4 for posting his tutorial. Today, on my relatively new 9 month old system, I got my third BSOD in as many months. I was using BlueScreenView and it wasn't giving me enough specific information. I did get a kick out of the reproduced BlueScreen though. When you see a real MS BSOD, it gives you about 15 seconds to read it and then your system reboots. You practically need a camera to be able to study it!

WinDbg gives me accurate information. Microsoft has really improved their software. I was able to pinpoint the problem to nvlddmkm.sys, an nVidia video driver file. I will update them later. One thing I find difficult are the "kd>" commands on the bottom of the screen. I looked in the help file and I cannot find any list or explanation for them. Can someone please tell me where in the Help file these commands are located?
 
Last edited:

My Computer

OS
Windows 7 Pro x64
When i load a specific dump file this happens , but if i get a .dmp from here the bug check seems to work fine :confused: any help :) thanx
 

Attachments

  • 1.png
    1.png
    86.6 KB · Views: 43
  • 2.png
    2.png
    73.1 KB · Views: 46

My Computer

Computer Manufacturer/Model Number
custom
OS
windows 7 ultimate x64
CPU
AMD Athlon II X3 445 Rana 45nm Technology
Motherboard
BIOSTAR Group N68S3B
Memory
8gbram
Graphics Card(s)
32MB GeForce 7025 / nForce 630a (Biostar Microtech Int'l)
Screen Resolution
1280x1024
Hard Drives
488GB Seagate ST350041 3AS SCSI Disk Device (ATA)
PSU
400w ?
Keyboard
usb
Mouse
usb
When i load a specific dump file this happens , but if i get a .dmp from here the bug check seems to work fine :confused: any help :) thanx

I assume you're referring to the dump file initially loading then stopping after -
Code:
[FONT=lucida console]...............................................................[/FONT]
[FONT=lucida console]................................................................[/FONT]
[FONT=lucida console]............................[/FONT]
[FONT=lucida console]Loading User Symbols[/FONT]
[FONT=lucida console]Loading unloaded module list[/FONT]
[FONT=lucida console].............[/FONT]
??

If so, type/ paste in the commands at the kd> command line -
Code:
[FONT=lucida console]!analyze -v;r;kv;lmtn[/FONT]

That sometimes happens to me (Windbg pausing/ waiting); not sure exactly why.

In the 6.12 version you are running, additional commands may be helpful -
Code:
[FONT=lucida console]!analyze -v;r;kv;lmtn;lmtsmn;!sysinfo cpuinfo;!sysinfo machineid;!sysinfo cpuspeed;!sysinfo smbios[/FONT]

It also appears to me that the command window is "out".

2x-click anywhere along the yellow highlighted area the red arrows are pointing to:

Regards. . .

jcgriff2
 

My Computer

OS
Windows 7 - Vista
JC, would you mind defining each of those debugging commands you have listed?

r;kv;lmtn
Another thing, sometimes when debugging a dump file it'll say "timestamp for example.sys could not be loaded, symbols for example.sys could not be loaded". What does this mean, exactly? I believe I've had a few dumps that the driver in those "errors" I guess you could call them were the culprit.
 

My Computer

OS
Windows 7 Ultimate x64
CPU
i7-2600K
Motherboard
Asus P8P67 Pro B3 (Rev 3.1)
Memory
Corsair Vengeance 8GB DDR3 @ 1600Mhz (9-9-9-24)
Graphics Card(s)
Asus Radeon HD 5850 (Crossfire)
Sound Card
X-Fi Titanium Fata1ity Professional
Monitor(s) Displays
Acer Eyefinity
Screen Resolution
5040x1050
Hard Drives
Samsung Spinpoint F3 1TB
PSU
Corsair CMPSU-750TX 750W
Case
LIAN LI Lancool PC-K56
Cooling
Corsair H70
Keyboard
Ducky Shine / Das Ultimate Blank
Mouse
Razer Lachesis
JC, would you mind defining each of those debugging commands you have listed?

!analyze -v - analyze command verbose mode
r - show registers
kv - display stack backtrace

List loaded modules command
lmtn
lmtsmn

t = display timestamps
n = display image name
sm = sort s by module name (default = "start" memory address)

!analyze -v;r;kv;lmtn;lmtsmn
Those commands will list the loaded drivers twice - 1 sorted by memory address; 1 sorted by driver name

Please see - http://www.sevenforums.com/crash-lockup-debug-how/34871-advanced-principles-debugging.html


Another thing, sometimes when debugging a dump file it'll say "timestamp for example.sys could not be loaded, symbols for example.sys could not be loaded". What does this mean, exactly? I believe I've had a few dumps that the driver in those "errors" I guess you could call them were the culprit.

Yes - 3rd party driver symbol errors usually = guilty

Microsoft OS drivers can show up with symbol errors for several different reasons
- symbol config is wrong
- the symbol file is not available from the MSDL SYM site, e.g., possibly a recent Windows Update updated the driver and it has not yet been added (happened recently with win32k.sys)
- dump is corrupted
- cracked Windows
- other...

Try .reload command

Regards. . .

John
 

My Computer

OS
Windows 7 - Vista

My Computer

OS
Windows 7 Ultimate x64
CPU
i7-2600K
Motherboard
Asus P8P67 Pro B3 (Rev 3.1)
Memory
Corsair Vengeance 8GB DDR3 @ 1600Mhz (9-9-9-24)
Graphics Card(s)
Asus Radeon HD 5850 (Crossfire)
Sound Card
X-Fi Titanium Fata1ity Professional
Monitor(s) Displays
Acer Eyefinity
Screen Resolution
5040x1050
Hard Drives
Samsung Spinpoint F3 1TB
PSU
Corsair CMPSU-750TX 750W
Case
LIAN LI Lancool PC-K56
Cooling
Corsair H70
Keyboard
Ducky Shine / Das Ultimate Blank
Mouse
Razer Lachesis
My pleasure to try and help/ explain.

If you have not yet found the Windbg HELP file, look for debugger.chm in the Windbg installation directory, usually - c:\program files\debugging tools for windows

Or type .hh in the kd> Windbg command line.

Regards. . .

John
 

My Computer

OS
Windows 7 - Vista
Back
Top