Configuring the "Debugging Tools"

okay trying the analyze! v command as we speak,

will post the result of reading my own dmp files on my own BSOD thread,

cheers for the help

KP!
 

My Computer

Computer type
Laptop
Computer Manufacturer/Model Number
Asus K43S
OS
windows 7 home premium 64bit
CPU
Intel Core i3-2330m
Memory
6 Gib 10600 DDR3 RAM
Graphics Card(s)
Radeon 6730
Monitor(s) Displays
Generic PnP Monitor
Hard Drives
Intel SSD 330 Series 120 Gb
Seagate Momentus 750 Gb
Internet Speed
Slow, lol
Antivirus
KIS 2013
It was a bit confusing installing this. I already had the Windows Performance Toolkit installed so maybe that makes the installer not work properly.

Anyway, I downloaded sdksetup.exe from the second link here Download and Install Debugging Tools for Windows which goes to Windows Software Development Kit (SDK) for Windows 8

Running that once download, WPT was already checked (as was .NET Framework 4.0) so I ticked Debugging Tools and when it had finished downloading, I ran the new sdksetup.exe in the StandaloneSDK folder but it told me that everything was already installed. Re-running the original sdksetup.exe still only shows WPT (and .NET) checked.

After doing this a few times, it's installed and I have the shortcuts in the Start Menu under Windows Kits (next to the WPT ones I already had) but at no time did the installer offer me a choice of x86/x64 or location to install to, in fact it didn't give me any indication that it was going to install anything, nor that it had.
 

My Computer

Computer type
PC/Desktop
OS
Windows 7 Ultimate x64
CPU
Phenom II X4 955
Motherboard
MSI 990FXA-GD80
Memory
16GB (4*4GB) DDR3 Corsair Vengeance
Graphics Card(s)
6950 2GB
Sound Card
Onboard Realtek
Monitor(s) Displays
Dell 24" IPS LCD
Hard Drives
Samsung Evo 256GB SSD, Samsung 2TB, & Samsung 500GB HDDs
PSU
Antec CP-850
Case
Bench
Cooling
TRUE rev.c
It would've had a progress bar during installation and then when complete it would've populated the Start Menu programs menu with a Debugging Tools for Windows entry. To find the x64/x86 versions of the debugger, you'll navigate to the appropriate Program Files (x86) folder (most likely Windows Kits), and then go to the Debuggers subfolder where it'll have a separate directory for each version. There's even a redistributable for when you just want to install the tool itself to a system.

Understand that since 2009 (time this article was posted), the Windows dev kits - including their installer - has been altered considerably. That may explain the discrepancies in this tutorial.
 

My Computer

OS
Windows 7 64-bit
Sure, I understand the tutorial was written a while ago. Just wanted to point out that it might be an idea to update it, as it's a bit confusing now with the current installer. :)
 

My Computer

Computer type
PC/Desktop
OS
Windows 7 Ultimate x64
CPU
Phenom II X4 955
Motherboard
MSI 990FXA-GD80
Memory
16GB (4*4GB) DDR3 Corsair Vengeance
Graphics Card(s)
6950 2GB
Sound Card
Onboard Realtek
Monitor(s) Displays
Dell 24" IPS LCD
Hard Drives
Samsung Evo 256GB SSD, Samsung 2TB, & Samsung 500GB HDDs
PSU
Antec CP-850
Case
Bench
Cooling
TRUE rev.c
can I copy the dump to another computer

Will the setup for the debugger work if I copied the .dmp file to another computer. In other words, if I config the debugger on my computer, can I debug a file I copied from another computer?
 

My Computer

Computer Manufacturer/Model Number
HP Compaq 6000 Pro SFF PC
OS
Windows 7 Professional 64 bit 6.1.7600 build 7600
CPU
Intel(R) Core(TM)2 Duo e8500 @ 3.16GHZ 3.17 GHZ
Motherboard
??
Memory
6mb
Graphics Card(s)
NVIDIA Quadro FX 380 LP; DirectX 10
Sound Card
NVIDIA HD Audio
Monitor(s) Displays
Acer X223W (x 2)
Hard Drives
SAMSUNG HD254GJ; 231 GB total; Partition C: 175 GB free (225 GB total); partition D: 789 mb free (6 GB total); E: CD/DVD
file system NTFS
PSU
??
Case
??, but it is a small footprint, low-profile desktop
You mean taking a dump file from one PC and running it through the debugger on your debugging machine? Of course! How else are we tech support reading the dump files from all of you guys? :)
 

My Computer

OS
Windows 7 64-bit
can you tell me what all this means?

Microsoft (R) Windows Debugger Version 6.2.9200.20512 X86
Copyright (c) Microsoft Corporation. All rights reserved.

Loading Dump File [W:\Exception.exe(1).6844.dmp]
User Mini Dump File: Only registers, stack and portions of memory are available
Symbol search path is: SRV*C:\SymCache*http://msdl.microsoft.com/download/symbols
Executable search path is:
Windows 7 Version 7601 (Service Pack 1) MP (4 procs) Free x86 compatible
Product: WinNt, suite: SingleUserTS
Machine Name:
Debug session time: Thu Aug 1 08:20:20.000 2013 (UTC - 4:00)
System Uptime: not available
Process Uptime: 0 days 0:03:45.000
................................................................
....................
Loading unloaded module list
....
This dump file has an exception of interest stored in it.
The stored exception information can be accessed via .ecxr.
(1abc.10d0): Access violation - code c0000005 (first/second chance not available)
*** ERROR: Symbol file could not be found. Defaulted to export symbols for msvbvm60.dll -
eax=002b1024 ebx=021a6fa4 ecx=00ffffff edx=0219f360 esi=01666234 edi=00000000
eip=72949e85 esp=0012fd3c ebp=0012fd58 iopl=0 nv up ei pl nz na po nc
cs=001b ss=0023 ds=0023 es=0023 fs=003b gs=0000 efl=00010202
msvbvm60!EbLoadRunTime+0xfa3:
72949e85 ff5104 call dword ptr [ecx+4] ds:0023:01000003=????????
 

My Computer

Computer Manufacturer/Model Number
HP Compaq 6000 Pro SFF PC
OS
Windows 7 Professional 64 bit 6.1.7600 build 7600
CPU
Intel(R) Core(TM)2 Duo e8500 @ 3.16GHZ 3.17 GHZ
Motherboard
??
Memory
6mb
Graphics Card(s)
NVIDIA Quadro FX 380 LP; DirectX 10
Sound Card
NVIDIA HD Audio
Monitor(s) Displays
Acer X223W (x 2)
Hard Drives
SAMSUNG HD254GJ; 231 GB total; Partition C: 175 GB free (225 GB total); partition D: 789 mb free (6 GB total); E: CD/DVD
file system NTFS
PSU
??
Case
??, but it is a small footprint, low-profile desktop
It starts off with basic info about the dump file, symbols, and the system state at time of the crash (e.g. "Debug session time" is time of crash).

The second half tells you that it has an exception context stored in it of an exception that occurred during the dump file - primarily the exception that triggered the crash. It tells you the type of exception (c0000005 - memory could not be read/written/executed). It then alerts you that symbols for a particular module that's related (msvbvm60.dll) could not be found, and then dumps the CPU register contents during the exception and the instruction that caused it (msvbvm60!EbLoadRunTime+0xfa3).

To set to the context of Windbg to the point of the exception, follow what it says (type .ecxr command). Best step after that would be to dump the callstack with the kv command.

Your other option is to type !analyze -v. This will have a basic analysis engine sift through the data and display to you a general synopsis of what it thinks was the problem. You can use this as a starting point for your own manual analysis.
 

My Computer

OS
Windows 7 64-bit
Access denied

It wont let me access my dump files. I keep getting something that says:

Could not find the
C:\Windows\Minidump\111713-24359-01.dmp Dup File, Win32
error 0n5

Access is Denied

I believe I need to turn on administrator priviliges but I could be wrong, any advice on what to do here?
 

My Computer

Computer type
Laptop
Computer Manufacturer/Model Number
Sony
OS
Windows 7 Ultimate x64
Antivirus
Kaspersky
Browser
Google Chrome

My Computer

Computer type
Laptop
Thanks Geo64 and zigzag! Got it to work!

For any noobs who follow:
1. Open a command prompt as an admin, that'll give you:
"C:\Windows\system32>"

2. Enter "chdir /d C:\debuggers"... this will give you a new prompt "C:\debuggers"

3. Enter "windbg.exe -IA" and Et Voila!

Thanks again guys! :D

It isn't working for me ..

I get this:

Code:
C:\Windows\system32>chdir /d C:\debuggers

C:\debuggers>windbg.exe -IA
'windbg.exe' is not recognized as an internal or external command,
operable program or batch file.

C:\debuggers>windbg.exe -IA
'windbg.exe' is not recognized as an internal or external command,
operable program or batch file.

C:\debuggers>
Edit:

Okay I jumped back to post #48 to find out a little more about why it isn't working for me.

  • Expand the start menu to :
    Start > All Programs > Windows Kits > Debugging tools for Windows (x64)
  • Right click on Windbg (x64) > Properties .
  • Look at "targrt". If you installed at the default path, the tagret is :
    "C:\Program Files (x86)\Windows Kits\8.0\Debuggers\x64\windbg.exe"
Open the command prompt.

  • Type -- CD C:\Program Files (x86)\Windows Kits\8.0\Debuggers\x64 and hit enter.
  • When the directory is accordingly changed, type windbg.exe -IA
Is it done now?

but I don't have a Windows Kits in my start programs :(

Shouldn't I have it since I grabbed it from here: Windows Driver Kit (WDK) and Debugging Tools for Windows (WinDbg) downloads

I just checked the folder C:\debuggers I made and there are no files in it. I don't know why.. I did install it. What am I doing wrong? (default is C:\Program Files\Microsoft SDKs\Windows\v7.1 but I changed it on the advice earlier in this thread to make it easier to find and all).

I even TRIED to let it go to the default C:\Program Files\Microsoft SDKs\Windows\v7.1 and it is not there neither .. :(

I even tried what was suggested here:
Try it: Debuggers (x64)

A bit older version, but works exactly the same. Contains the debugger tool only and nothing more.
But I get this:
"Please insert the last disk of the Multi-Volume set and click OK to continue. "

I also tried the stand alone .. :(
 

Attachments

  • Debugger_not_installing_the64bit.jpg
    Debugger_not_installing_the64bit.jpg
    40.4 KB · Views: 57
  • WindowsRemoteDebuggingClientError.jpg
    WindowsRemoteDebuggingClientError.jpg
    68.8 KB · Views: 1
Last edited:

My Computer

Computer type
PC/Desktop
Computer Manufacturer/Model Number
HP-Pavilion-a6000-Desktop-PC
OS
Microsoft Windows 7 Professional Edition Service Pack 1 (build 7601), 64-bit
CPU
Intel(R) Core(TM)2 Quad Q9550 @2.83GHz (Xeon) Socket 775 LGA
Motherboard
ASUSTeK Computer INC. Benicia (P35/G33/G31)
Memory
4095 MB (4 x 1024 MBytes DDR2 Dual Symmetric)
Graphics Card(s)
Sapphire HD 7770 GHz Edition (shows Radeon R7 200)
Sound Card
Realtek High Definition Audio Driver Version 6.0.1.6662
Monitor(s) Displays
HP w19b 18.6" 5:3 (SN: CNC703PN1G)
Screen Resolution
1440 x 900
Hard Drives
1080 GB total
C: (320Gb): WDC WD3200AAKS-75L9A0 ATA
D: (Optical Drive): ATAPI DVD A DH16A6S ATA Device
E: (1Tb): WDC WD10EARS-00S8B1 ATA
F: (Backup 2 Tb): Clikfree Backup Drive USB
PSU
GX750
Case
Black/Blue APEVIA X-Hermes
Cooling
2 Top , 1 back, 1 front fan all 180 mm & side 200mm
Keyboard
Logitech G110
Mouse
Logitech G500s
Internet Speed
High speed cable
Antivirus
Avast! Internet Security 2014.9.0.2021
Browser
Firefox 44 (x86 en-US)
Other Info
BIOS American Megatrends
Date:
09/10/09 10:25:18 Ver: 5.43
Get this one and follow the instructions of the initial posts.

Some places to get windbg got their nature changed over the passage of time.
 

My Computer

Computer type
PC/Desktop
Computer Manufacturer/Model Number
Self Assembled
OS
Microsoft Windows 10 Pro Insider Preview 64-bit
CPU
Intel(R) Core(TM) i3-4130 CPU @ 3.40GHz
Motherboard
Gigabyte Technology Co., Ltd. B85M-D3H
Memory
Corsair Vengence 4GB x2 (8.00GB Dual-Channel DDR3 @ 798MHz)
Graphics Card(s)
2047MB GeForce GTS 450 (ZOTAC International)
Sound Card
Onboard (Realtek High Definition Audio)
Monitor(s) Displays
LG Flatron E2040T
Screen Resolution
1600x900
Hard Drives
Western Digital 1 TB
Seagate 500 GB
PSU
Corsair VS550
Case
Cooler Master K380
Cooling
Cooler Master Seidon 120V Plus
Keyboard
Logitech MK260r
Mouse
Logitech MK260r
Internet Speed
PMPL Broadband
Antivirus
Windows Defender + MBAM
Browser
Firefox
Other Info
Dell Studio 15" Laptop
Get this one and follow the instructions of the initial posts.

Some places to get windbg got their nature changed over the passage of time.

Ah okay good thank you! Now I can use the debugger to figure out why IELowutil.exe keeps on stopping.
 

Attachments

  • Dubugger_registered.jpg
    Dubugger_registered.jpg
    40 KB · Views: 57

My Computer

Computer type
PC/Desktop
Computer Manufacturer/Model Number
HP-Pavilion-a6000-Desktop-PC
OS
Microsoft Windows 7 Professional Edition Service Pack 1 (build 7601), 64-bit
CPU
Intel(R) Core(TM)2 Quad Q9550 @2.83GHz (Xeon) Socket 775 LGA
Motherboard
ASUSTeK Computer INC. Benicia (P35/G33/G31)
Memory
4095 MB (4 x 1024 MBytes DDR2 Dual Symmetric)
Graphics Card(s)
Sapphire HD 7770 GHz Edition (shows Radeon R7 200)
Sound Card
Realtek High Definition Audio Driver Version 6.0.1.6662
Monitor(s) Displays
HP w19b 18.6" 5:3 (SN: CNC703PN1G)
Screen Resolution
1440 x 900
Hard Drives
1080 GB total
C: (320Gb): WDC WD3200AAKS-75L9A0 ATA
D: (Optical Drive): ATAPI DVD A DH16A6S ATA Device
E: (1Tb): WDC WD10EARS-00S8B1 ATA
F: (Backup 2 Tb): Clikfree Backup Drive USB
PSU
GX750
Case
Black/Blue APEVIA X-Hermes
Cooling
2 Top , 1 back, 1 front fan all 180 mm & side 200mm
Keyboard
Logitech G110
Mouse
Logitech G500s
Internet Speed
High speed cable
Antivirus
Avast! Internet Security 2014.9.0.2021
Browser
Firefox 44 (x86 en-US)
Other Info
BIOS American Megatrends
Date:
09/10/09 10:25:18 Ver: 5.43
You are welcome. :)
 

My Computer

Computer type
PC/Desktop
Computer Manufacturer/Model Number
Self Assembled
OS
Microsoft Windows 10 Pro Insider Preview 64-bit
CPU
Intel(R) Core(TM) i3-4130 CPU @ 3.40GHz
Motherboard
Gigabyte Technology Co., Ltd. B85M-D3H
Memory
Corsair Vengence 4GB x2 (8.00GB Dual-Channel DDR3 @ 798MHz)
Graphics Card(s)
2047MB GeForce GTS 450 (ZOTAC International)
Sound Card
Onboard (Realtek High Definition Audio)
Monitor(s) Displays
LG Flatron E2040T
Screen Resolution
1600x900
Hard Drives
Western Digital 1 TB
Seagate 500 GB
PSU
Corsair VS550
Case
Cooler Master K380
Cooling
Cooler Master Seidon 120V Plus
Keyboard
Logitech MK260r
Mouse
Logitech MK260r
Internet Speed
PMPL Broadband
Antivirus
Windows Defender + MBAM
Browser
Firefox
Other Info
Dell Studio 15" Laptop
Most threads lead to this thread. I don't seem to have the right symbols. I have the SDK all set up as per the first thread and all of that appears to be correct. The symbols link is a dead link. I searched and found this link: Download Windows Symbol Packages

I went to the windows 7 symbols and downloaded the first three symbol packages and still get the kernel symbols are wrong error message.

I am running windows 7 home premium 64 bit. Not sure what I am missing, I am setting the file path properly.
 

My Computer

Computer type
PC/Desktop
Computer Manufacturer/Model Number
Custom build Corsair 750 case
OS
Windows 7 home premium 64bit
CPU
I7 4790K
Motherboard
Gigabit
Memory
16G Kingston extreme
Graphics Card(s)
EVGA 4G
Hard Drives
Samsung 250G SSD, 4T Western Digital
Antivirus
Microsoft Security essentials, Malwarebites
Open a blank instance of WinDBG, then press Ctrl+S.

Does the Windows that opens, look like this?

1.PNG
 

My Computer

Computer type
PC/Desktop
Computer Manufacturer/Model Number
Golden Mk. I.4
OS
Windows 10 Pro x64 ; Xubuntu x64
CPU
Intel i7 860 @ 2.80 GHz O/C'ed to 4.0GHz
Motherboard
Gigabyte P55A-UD3R Rev.1. Award BIOS F13
Memory
16GB Corsair Vengance DDR3 @ 661 MHz Dual Channel (9-9-9-24)
Graphics Card(s)
EVGA NVidia GTX 560 1024MB
Sound Card
Realtek Integrated
Monitor(s) Displays
Dual Samsung SyncMaster 2494HS
Screen Resolution
1920*1080 and 1920*1080
Hard Drives
1*Samsung 840 EVO 120GB SSD;
1*OCZ Vertex 2 60GB SSD;
2*Samsung F3 SpinPoint 1TB in RAID0;
1*Samsung F1 SpinPoint 1TB;
2*Western Digital 1TB External USB 3.0
1*Western Digital 500GB External USB 3.0
1*Seagate 500GB External USB 2.0
PSU
Thermaltake ToughPower QFan 750W
Case
Thermaltake Element S VK60001W2Z
Cooling
Corsair H60 Water Cooling, 2*230mm and 2*80mm case fans
Keyboard
Logitech G110
Mouse
Logitech MX518
It does now :) Thanks
 

My Computer

Computer type
PC/Desktop
Computer Manufacturer/Model Number
Custom build Corsair 750 case
OS
Windows 7 home premium 64bit
CPU
I7 4790K
Motherboard
Gigabit
Memory
16G Kingston extreme
Graphics Card(s)
EVGA 4G
Hard Drives
Samsung 250G SSD, 4T Western Digital
Antivirus
Microsoft Security essentials, Malwarebites
:thumbsup:
 

My Computer

Computer type
PC/Desktop
Computer Manufacturer/Model Number
Golden Mk. I.4
OS
Windows 10 Pro x64 ; Xubuntu x64
CPU
Intel i7 860 @ 2.80 GHz O/C'ed to 4.0GHz
Motherboard
Gigabyte P55A-UD3R Rev.1. Award BIOS F13
Memory
16GB Corsair Vengance DDR3 @ 661 MHz Dual Channel (9-9-9-24)
Graphics Card(s)
EVGA NVidia GTX 560 1024MB
Sound Card
Realtek Integrated
Monitor(s) Displays
Dual Samsung SyncMaster 2494HS
Screen Resolution
1920*1080 and 1920*1080
Hard Drives
1*Samsung 840 EVO 120GB SSD;
1*OCZ Vertex 2 60GB SSD;
2*Samsung F3 SpinPoint 1TB in RAID0;
1*Samsung F1 SpinPoint 1TB;
2*Western Digital 1TB External USB 3.0
1*Western Digital 500GB External USB 3.0
1*Seagate 500GB External USB 2.0
PSU
Thermaltake ToughPower QFan 750W
Case
Thermaltake Element S VK60001W2Z
Cooling
Corsair H60 Water Cooling, 2*230mm and 2*80mm case fans
Keyboard
Logitech G110
Mouse
Logitech MX518
FWIW, I needed to change something in Powershell to get this command to work.

Another entirely optional step that makes life easier. By registering WinDBG (the main debugger you'll want to use) as the default handler for common dump file types, you'll be able to double-click on a dump and have it open in WinDBG without having to go through the "File | Open..." menu operation every time. This registration needs to be performed from an elevated CMD prompt (run CMD as administrator):
C:\>cd debuggers
C:\debuggers>windbg.exe -IA

I needed to navigate to c:\debuggers\debuggers\x64\ then type the command as .\windbg.exe -IA
and that worked for me.
 

My Computer

Computer type
PC/Desktop
Computer Manufacturer/Model Number
Custom
OS
Dual Boot: Windows 8.1 & Server 2012r2 VMs: Kali Linux, Backbox, Matriux, Windows 8.1
CPU
A10 7700 Kavari SteamRoller
Motherboard
ASUS A88XM-PLUS (FM2+ )
Memory
8GB DDR3 SDRAM PC3-8500
Graphics Card(s)
1024MB ATI AMD Radeon R7 Graphics
Sound Card
Realtek High Definition Audio
Monitor(s) Displays
Samsung
Hard Drives
SSD Crucial 120gb
WD VelociRaptor 1tb
PSU
Rosewill Gaming 650w
Case
Rosewill Galaxy 2
Internet Speed
55/12
Antivirus
Malwarebytes, MSE, SAS
Browser
FireFox, Chrome
   Note
For updated WinDBG install and configuration instructions please visit the following link - WinDBG - Install and Configure for BSOD Analysis


How to Analyse Bugcheck and Process Crash Dumps


Download the debugger package that matches YOUR machine's Windows version
http://www.microsoft.com/whdc/devtoo...g/default.mspx

In other words, if you're running 32-bit Windows, install the 32-bit version of the "Debugging Tools for Windows", irrespective of whether you intend to debug 32-bit or 64-bit code. Likewise for x64 - download and install the x64 package, and you'll still be able to debug 32-bit crashes. Few home and small business users would be running Itaniums, so don't accidentally download the IA-64 (Itanium) build. Itanium is a vastly different architecture to "x64" (AMD64, also known as EM64T when sold by Intel).
Override the default install path and install to c:\debuggers instead
This is entirely optional but you'll be happier, especially if you intend to do a fair amount of dump analysis. Choose the "custom" install option and use c:\debuggers (or d:\debuggers or whatever other drive) as the install path. It makes it easier to work with the tools and removes that pesky "Program Files" space from the path name. The debugger package is a lot more command-line oriented than many apps nowadays.
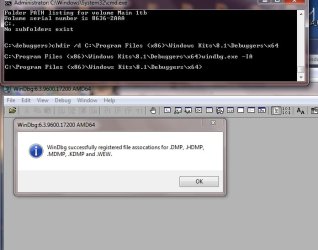
Register WinDBG as the default handler for dump files
Another entirely optional step that makes life easier. By registering WinDBG (the main debugger you'll want to use) as the default handler for common dump file types, you'll be able to double-click on a dump and have it open in WinDBG without having to go through the "File | Open..." menu operation every time. This registration needs to be performed from an elevated CMD prompt (run CMD as administrator):
C:\>cd debuggers
C:\debuggers>windbg.exe -IA
In response, WinDBG should pop up a dialog box that says this:
---------------------------
WinDbg:6.11.0001.402 AMD64
---------------------------
WinDbg successfully registered file assocations for .DMP, .HDMP, .MDMP, .KDMP and .WEW.
---------------------------
OK
---------------------------
Set your symbol path
This is NOT optional. In fact, getting it wrong is the #1 reason for frustration when learning to debug. There are several ways to get it right, and this is possibly the simplest:

a) Start WinDBG
b) WITHOUT opening any dump files, click File, "Symbol File Path..."
c) Set the path to be the following:It can be any valid local path, c:\Symbols or e:\MySymbols or whatever, but the SRV and http portions must be exactly as above. Don't move the local path around too much though because the idea is to build up a local cache of symbols that minimises your waiting time while symbols are being downloaded from MS. That local cache can grow quite large over time, if you do a lot of dump analysis, and the debugger will be subsequently quicker to open new dumps because of the larger symbols cache.

d) Exit WinDBG. It should ask you whether you wish to save workspace settings. "Yes" is almost always the appropriate answer to WinDBG's workspace prompts. From now onwards the symbol path should already be set whenever you start WinDBG.

With the correct symbol path configured, whenever the debugger encounters a new binary for which it must find symbols, it will:

1. Check first in C:\SymCache. If a matching symbol is not found...
2. Check whether the symbol is available from the MS symbol server. If it is, copy it down to C:\SymCache so it can be cached for faster future operation.

In practice, the MS symbol server will contain symbols for MS binaries (exe, dll, sys), but not for 3rd-party modules. As a consequence, the lack of symbols availability can be interpreted as a hint that this may not be a Microsoft component.


Opening and analysing dumps
Once you've done the preparatory steps above, you can double-click (if registered) or "File | Open Crash Dump..." in WinDBG to get it to open and analyse a minidump or any other memory dump, including crashes from user-mode processes. If you want to re-invoke its automated analysis engine, use the !ANALYZE -V command. The "v" switch stands for "verbose" - it produces additional detail which may be useful.

The debugger will attempt to find the relevant symbols and then produce a diagnosis, to the best of its automated abilities. Look for a line like this in the output:

Probably caused by : win32k.sys ( win32k!FindTimer+57 )

If the automated diagnosis references a non-default driver, the first task is to update the driver. If that doesn't help and subsequent dumps all still point at the same driver again, try removing it as a test.

In this case, win32k.sys is pinpointed and that is a very important driver which is a part of Windows itself.

   Note
When the "probably caused by" verdict points at an OS component, the situation is more complex and minidump analysis is not always sufficient to find the true cause of the crash.


More (Optional) Debugger Trickery For The Interested
A minidump contains 3 main items of information:

1) The stack of the thread which directly caused the crash. This can be viewed with the various 'k' (stack unwind) commands:
1: kd> kL
Child-SP RetAddr Call Site
fffffa60`09cd0528 fffff800`01cb60ee nt!KeBugCheckEx
fffffa60`09cd0530 fffff800`01cb5abc nt!KiBugCheckDispatch+0x6e
fffffa60`09cd0670 fffff800`01cc96bd nt!KiSystemServiceHandler+0x7c
fffffa60`09cd06b0 fffff800`01cd0cff nt!RtlpExecuteHandlerForException+0xd
fffffa60`09cd06e0 fffff800`01c8dd83 nt!RtlDispatchException+0x22f
fffffa60`09cd0dd0 fffff800`01cb61a9 nt!KiDispatchException+0xc3
fffffa60`09cd13d0 fffff800`01cb4d8d nt!KiExceptionDispatch+0xa9
fffffa60`09cd15b0 fffff960`0011c947 nt!KiGeneralProtectionFault+0xcd
fffffa60`09cd1740 fffff960`00121e2d win32k!FindTimer+0x57
fffffa60`09cd1790 fffff800`01cb5df3 win32k!NtUserKillTimer+0x5d
fffffa60`09cd17d0 00000000`7790c24a nt!KiSystemServiceCopyEnd+0x13
A "stack" is a thread-specific region of memory used for several purposes such as the temporary storage of data, the passing of data between different functions, and for many other more specialised needs such as quick string reversal ("debugger" reversed becomes "reggubed"). The "stack unwind" shown above reveals that the nt!KeBugCheckEx (blue screen) function was called by nt!KiBugCheckDispatch, which was in turn called by nt!KiSystemServiceHandler, and so on downwards. Therefore, function displayed by the debugger at the top of the stack is the latest in terms of chronological order. The specific stack at the time of a crash can be likened to a crash "signature" which can be used to search for other instances of similar problems, and hence potential solutions.

2) The processor register context of that thread:
1: kd> r
rax=fffffa6009cd0630 rbx=fffffa6009cd17d0 rcx=000000000000003b
rdx=00000000c0000005 rsi=fffff80001cb5df3 rdi=fffff80001e64df4
rip=fffff80001cb6350 rsp=fffffa6009cd0528 rbp=fffffa6009cd1508
r8=fffff9600011c947 r9=fffffa6009cd0ee0 r10=0000000000000000
r11=0000000000000001 r12=fffffa6009cc4000 r13=fffffa6009cd4000
r14=fffff80001c61000 r15=fffff80001daf4ec
iopl=0 nv up ei ng nz na po nc
cs=0010 ss=0018 ds=002b es=002b fs=0053 gs=002b efl=00000286
nt!KeBugCheckEx:
fffff800`01cb6350 48894c2408 mov qword ptr [rsp+8],rcx ss:0018:fffffa60`09cd0530=000000000000003b
Registers can be thought of as the fastest memory available to the processor. IA-32 (x86) and AMD64 (x64) both provide "general purpose" and specialised registers, and AMD64 is an extension of the simpler IA-32 architecture. Note that "registers" are not in any direct way related to the "registry", despite the name similarity.

In the example above, the 64-bit Instruction Pointer register (RIP) which contains the address of the next instruction to execute was in nt!KeBugCheckEx at the time of the crash, which is not surprising given that's the "bluescreen" function. The actual problem function which led to the crash is several frames lower in the stack - also highlighted in red.

3) A list of loaded modules at the time of the crash. The 'lm' (list modules) command can list these:
1: kd> lm
start end module name
fffff800`01c1b000 fffff800`01c61000 hal (deferred)
fffff800`01c61000 fffff800`02179000 nt (pdb symbols) c:\symcache\ntkrnlmp.pdb\149C563625CA49CEA2881CEDF5D55CCF2\ntkrnlmp.pdb
fffff960`00050000 fffff960`00301000 win32k (pdb symbols) c:\symcache\win32k.pdb\97A727330C184A9B9E1BDA0C3293AA142\win32k.pdb
fffff960`00410000 fffff960`0041a000 TSDDD (deferred)
fffff960`00620000 fffff960`00631000 cdd (deferred)
...
In the partial module listing above, the debugger has only encountered "nt" (NTOSKRNL itself) and win32k.sys code in the stack, which is why it has downloaded symbols (they have a PDB extension) from the MS symbol server for those two binaries, but not for hal.dll, TSDDD.dll, and cdd.dll. Their symbol status is listed as "deferred".
Even More Debugger Trickery For The Really Interested
Minidumps can also easily reveal basic information about the Windows version, service pack level, time of the crash, and system uptime:
1: kd> vertarget
Windows 7 Kernel Version 7600 MP (4 procs) Free x64
Product: WinNt, suite: TerminalServer SingleUserTS
Built by:
7600.16385.amd64fre.win7_rtm.090713-1255


Machine Name:
Kernel base = 0xfffff800`01c61000 PsLoadedModuleList = 0xfffff800`01e26db0
Debug session time: Thu Apr 2 07:07:55.076 2009 (GMT+11)
System Uptime: 0 days 0:02:00.122
Say you've identified a driver that you believe to be responsible, and now you want to see more particulars about that binary. Use 'lmvm' with the module name:
1: kd> lmvm tdrpm147
start end module name
fffffa60`0140c000 fffffa60`01590000 tdrpm147 (deferred)
Image path: \SystemRoot\system32\DRIVERS\tdrpm147.sys
Image name: tdrpm147.sys
Timestamp: Mon Oct 13 21:14:16 2008 (48F31F78)
CheckSum: 0018472C
ImageSize: 00184000
Translations: 0000.04b0 0000.04e4 0409.04b0 0409.04e4
To get more info on the processor(s):
1: kd> !cpuinfo
CP F/M/S Manufacturer MHz PRCB Signature MSR 8B Signature Features
1 6,15,11 GenuineIntel 2405 000000b600000000 20193ffe
Cached Update Signature 000000b600000000
Initial Update Signature 000000b600000000
To see the generic description for any given bugcheck code:
1: kd> !analyze -show D1
DRIVER_IRQL_NOT_LESS_OR_EQUAL (d1)
An attempt was made to access a pageable (or completely invalid) address at an
interrupt request level (IRQL) that is too high. This is usually
caused by drivers using improper addresses.
If kernel debugger is available get stack backtrace.
Arguments:
Arg1: 0000000000000000, memory referenced
Arg2: 0000000000000000, IRQL
Arg3: 0000000000000000, value 0 = read operation, 1 = write operation
Arg4: 0000000000000000, address which referenced memory
And the most useful command of all - it brings up the debugger's comprehensive help document (debuggers.chm):
1: kd> .hh
=============================================

   Note
Full dumps allow for much more meaningful analysis but they're hundreds of MB or even several GB in size, depending on the dump type, and for a 2-minute look at someone's BSoD problem a minidump is perfectly sufficient. If their system is crashing frequently and the dumps all point at the same 3rd-party driver - bingo. Otherwise, if virtually every dump points at a different culprit and they mostly look inscrutable, chances are it's a hardware issue or something which would require more advanced analysis methods.


I found your post in 2024 and I couldn't help but register an account on here and reply. All of this knowledge in one thread and the very first link about debugging and trying to figure out why our PCs are crashing and why certain apps are just not functioning correctly..... your link gives me this error!!!!

[FONT=&quot]An error (502 Bad Gateway) has occurred in response to this request. [/FONT]:rolleyes::mad:


Really? How ironic!
 

My Computers

System One System Two

  • OS
    64
  • Computer type
    PC/Desktop
Back
Top