Ridiculous Modified Memory usage

Evrip

New member
Local time
1:36 AM
Messages
5
Hi,

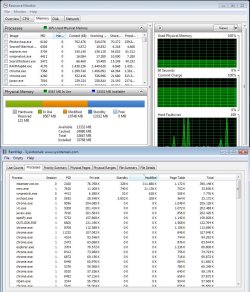
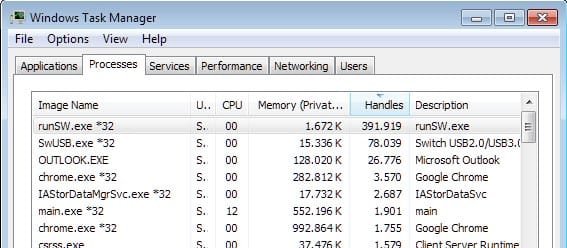
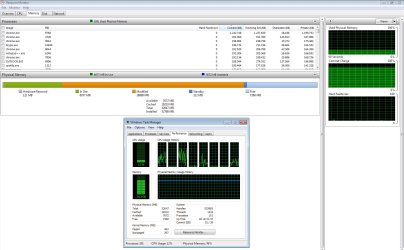
I've noticed lately that the Modified Memory is getting extremely high over a period of time. I can't really tell when this happens since my pc is running for days if a restart is not needed so it's hard to tell what's causing it.

I have this issue for a while now and I made a little research in the past which left me confused on whether the modified memory is reusable or not. Many people said that it is reusable and Windows will utilize it when the RAM is almost full. The problem here is that I'm running 32GB of RAM so it's a little hard to get to a point where windows are starving of RAM... until today where I received the Out of Memory pop-up window, telling me to shut down programs!

I reconfigured the paging file in the past, adding 2000MB (initial) to 8000MB (maximum) paging file for C:\ but it looks like it didn't solve the problem. Maybe that's not enough? I don't want to allocate a huge amount of my C:\ to paging file because it's an 128GB SSD and every GB is valuable. For the same reason I had to disable the Hybernation mode in windows because it was reserving 32GB of the SSD in order to fit all my RAM.

The rest of my HDDs do not have a paging file which I'm not sure if it's good or not.

Does anyone have any idea how to narrow this down?

Thank you in advance!
 

Attachments

  • ModifiedMem.jpg
    ModifiedMem.jpg
    778.9 KB · Views: 14

My Computer

Computer type
PC/Desktop
OS
Windows 7 64bit
CPU
Intel Core i7 3770K
Motherboard
Asrock OC Formula
Memory
G.Skill 32GB @2133
Graphics Card(s)
MSI N460GTX
Hard Drives
1x SSD OCZ Vertex 3 120GB
1x Seagate 500GB
2x Western Digital Red 2TB
1x Western Digital Red 4TB
Antivirus
Malwarebytes
Browser
Chrome
Modified Memory Usage

Well I'm not great at solving issues like yours but I suggest downloading:

RAMMap

Right click the executable and choose "Run as administrator"

It might provide some clues:

RamMap 1.jpg

RamMap 2.jpg

It's probably best to set your page file to "system managed" size unless you've swapped it to another drive.
 

My Computer

Computer type
Laptop
Computer Manufacturer/Model Number
ASUS
OS
Microsoft Windows 7 Home Premium 64-bit 7601 Multiprocessor Free Service Pack 1
CPU
AMD C-60 APU with Radeon(tm) HD Graphics
Motherboard
ASUSTeK COMPUTER INC. X501U
Memory
4.00 GB
Graphics Card(s)
AMD Radeon HD 6290 Graphics
Sound Card
(1) AMD High Definition Audio Device (2) Realtek High Defi
Screen Resolution
1366 x 768 x 32 bits (4294967296 colors) @ 60 Hz
Hard Drives
Hitachi HTS545050A7E380 SATA Disk Device
Antivirus
Comodo CIS & FW, SecureAplus App Whitelisting, Threatfire
Browser
Cyberfox 64bit, Opera 64bit, Airfox
Other Info
Spy-The-Spy, HitmanPro.Alert, Norton Connect Safe, MJRegWatcher, BitDefender TrafficLight, Voodoo Shield, Zemana AntiMalware
There isn't enough information available to diagnose the problem. A screenshot as Callender has suggested would help.

Memory usage of chrome is high but not nearly high enough to explain the situation. Such problems are often caused by driver issues but as the paged and non-paged memory is low that seems unlikely.

"Modified" refers to process private use memory that has been trimmed from the working set of the process. This is complex and I will not explain it further. Normally this would be written to the pagefile and converted to standby memory but with such a small pagefile that cannot happen. A larger pagefile would mask the symptoms but wouldn't solve the real problem.

But that isn't the real problem, merely a symptom. The real problem is why this and the commit charge has become so high.
 

My Computer

Computer type
PC/Desktop
Computer Manufacturer/Model Number
HP
OS
Windows 7 Pro 64 bit
CPU
Xeon W3520
Memory
8 GB
Graphics Card(s)
Nvidia Geforce 210
Thank you guys for your replies!

I had to reboot my pc due to updates installation and tweaking settings so the modified memory is gone for now. Sadly, that's before I see the post from Callender so no RamMap feedback for now.

I will keep the Resource Monitor and the RamMap open in my secondary monitor so i can constantly keep an eye on what's going on. As I said in my first post, it seems like it takes several days until I notice this issue. I can't tell if it's something that's build up over time (like 100MB modified mem per hour) or it becomes huge instantly by a specific program or action.

I am not sure what screenshot you mean. If you're talking about a RamMap screenshot, I will provide one as soon as I get a big modified mem again. If you mean something else, please let me know and I'll provide everything!
 

My Computer

Computer type
PC/Desktop
OS
Windows 7 64bit
CPU
Intel Core i7 3770K
Motherboard
Asrock OC Formula
Memory
G.Skill 32GB @2133
Graphics Card(s)
MSI N460GTX
Hard Drives
1x SSD OCZ Vertex 3 120GB
1x Seagate 500GB
2x Western Digital Red 2TB
1x Western Digital Red 4TB
Antivirus
Malwarebytes
Browser
Chrome
Modified Memory Usage

I've noticed something strange. After clearing event logs modified memory usage drops significantly:

RamMap 3.jpg

After a reboot it will return to normal usage. To my mind that indicates that modified memory usage might depend on event logging. On the other hand I could be completely wrong!
 

My Computer

Computer type
Laptop
Computer Manufacturer/Model Number
ASUS
OS
Microsoft Windows 7 Home Premium 64-bit 7601 Multiprocessor Free Service Pack 1
CPU
AMD C-60 APU with Radeon(tm) HD Graphics
Motherboard
ASUSTeK COMPUTER INC. X501U
Memory
4.00 GB
Graphics Card(s)
AMD Radeon HD 6290 Graphics
Sound Card
(1) AMD High Definition Audio Device (2) Realtek High Defi
Screen Resolution
1366 x 768 x 32 bits (4294967296 colors) @ 60 Hz
Hard Drives
Hitachi HTS545050A7E380 SATA Disk Device
Antivirus
Comodo CIS & FW, SecureAplus App Whitelisting, Threatfire
Browser
Cyberfox 64bit, Opera 64bit, Airfox
Other Info
Spy-The-Spy, HitmanPro.Alert, Norton Connect Safe, MJRegWatcher, BitDefender TrafficLight, Voodoo Shield, Zemana AntiMalware
This observation is intriguing! I was using Event Viewer too when the modified memory issue occurred! i left Event Viewer open before I leave for work and I will check again once I get back to see if the modified memory increased!
 

My Computer

Computer type
PC/Desktop
OS
Windows 7 64bit
CPU
Intel Core i7 3770K
Motherboard
Asrock OC Formula
Memory
G.Skill 32GB @2133
Graphics Card(s)
MSI N460GTX
Hard Drives
1x SSD OCZ Vertex 3 120GB
1x Seagate 500GB
2x Western Digital Red 2TB
1x Western Digital Red 4TB
Antivirus
Malwarebytes
Browser
Chrome
More info

This observation is intriguing! I was using Event Viewer too when the modified memory issue occurred! i left Event Viewer open before I leave for work and I will check again once I get back to see if the modified memory increased!

Well I cleared Event Logs using the tutorial here:

http://www.sevenforums.com/tutorials/25480-event-viewer-one-click-clear.html

Or more specifically used the file linked here:

Event Viewer One Click Clear - Post #79

Note: If you need your current logs for diagnostic purposes don't clear them! I'm just wondering if clearing logs will see a drop in modified memory usage on your machine?
 
Last edited:

My Computer

Computer type
Laptop
Computer Manufacturer/Model Number
ASUS
OS
Microsoft Windows 7 Home Premium 64-bit 7601 Multiprocessor Free Service Pack 1
CPU
AMD C-60 APU with Radeon(tm) HD Graphics
Motherboard
ASUSTeK COMPUTER INC. X501U
Memory
4.00 GB
Graphics Card(s)
AMD Radeon HD 6290 Graphics
Sound Card
(1) AMD High Definition Audio Device (2) Realtek High Defi
Screen Resolution
1366 x 768 x 32 bits (4294967296 colors) @ 60 Hz
Hard Drives
Hitachi HTS545050A7E380 SATA Disk Device
Antivirus
Comodo CIS & FW, SecureAplus App Whitelisting, Threatfire
Browser
Cyberfox 64bit, Opera 64bit, Airfox
Other Info
Spy-The-Spy, HitmanPro.Alert, Norton Connect Safe, MJRegWatcher, BitDefender TrafficLight, Voodoo Shield, Zemana AntiMalware
Modified memory is pagefile backed memory that has been trimmed from the working set of a process or other entity. There are only 2 way that modified memory can be reduced.

1. The entity from which the memory was trimmed terminates or it frees the address space from which it came. This is complex and difficult to describe in simple terms. Clearing the Event Log might do this in isolated cases. In this case that seems highly unlikely.

2. The modified memory is written to the pagefile and then moved to the standby list. The memory manager normally does this but in this case the pagefile is too small for that to be possible. A larger pagefile would eliminate the symptom (at least in the short term) but it wouldn't solve the real problem.

The question is: from what entity was the memory trimmed? Nothing in the Task Manager screenshot accounts for this. RAMMap should. I can't promise I will be able to interpret the results.
 

My Computer

Computer type
PC/Desktop
Computer Manufacturer/Model Number
HP
OS
Windows 7 Pro 64 bit
CPU
Xeon W3520
Memory
8 GB
Graphics Card(s)
Nvidia Geforce 210
Ok, my Modified Memory has reached ~10GB so I attached a few screenshot for you guys to see the current stats.

I was expecting RamMap to indicate a specific program that's consuming all that memory but instead, it shows almost all of Modified Memory as "Shareable".

I am pretty sure Event Viewer has something to do with this as the Modified Memory tripled since i opened it, but I can't find a direct relation.

I certainly can delete my log files to see if the Modified Memory will decrease but before I do that, is there anything you guys want me to check? As you can see, it took several days to reach this point and if i delete the log files (and actually do the trick), we will need another week or so to get a big Modified Memory again. So if you know any other monitoring tricks (like RamMap), let me know so I can check now!
 

Attachments

  • ModifiedMem4_1.jpg
    ModifiedMem4_1.jpg
    658.6 KB · Views: 2
  • ModifiedMem4_2.jpg
    ModifiedMem4_2.jpg
    497.7 KB · Views: 2

My Computer

Computer type
PC/Desktop
OS
Windows 7 64bit
CPU
Intel Core i7 3770K
Motherboard
Asrock OC Formula
Memory
G.Skill 32GB @2133
Graphics Card(s)
MSI N460GTX
Hard Drives
1x SSD OCZ Vertex 3 120GB
1x Seagate 500GB
2x Western Digital Red 2TB
1x Western Digital Red 4TB
Antivirus
Malwarebytes
Browser
Chrome
I'm sorry, i realize this thread is over a year old, but i think i have found a good solution. I stumbled upon this thread because i had exactly the same problem as Evrip. I did not find a working solution here so i continued searching. Then i came across another thread here: https://social.technet.microsoft.co...in7-x64-upwards-of-36gb-any?forum=w7itproperf

Someone in that thread suggested the following:
I believe I isolated it to this by adding the Handles column to Task Manager and watching it leak them like crazy, which eventually leads to paged (or non-paged, I forget which) memory spiking and ultimately "low memory" warnings.
I followed the instruction and there was one process that had 90k handles (the next highest was 5k). In my case it was some yahoo toolbar, but other people in that thread report all kinds of processes that caused the same problem for them, but what they have in common is they all found and solved the problem thanks to this one simple suggestion. Once i had found the guilty process, i stopped the service and the total memory usage dropped from 9GB to 5GB instantly. Even after that, the usage still continued to fall slowly, giving me another 0.5GB. I'm so happy i finally found the solution after having this problem for more than a year.

By the way, one other suggestion in said thread was to not only add the handles column, but also the GDI objects column. It might point to the problem as well, but in my case i saw the problem as soon as i looked at handles.
 

My Computer

Computer type
PC/Desktop
OS
Windows 7 Professional 64bit
The solution is simple - even over a year later. just reboot and the 'modified' will shrink.
 

My Computer

Computer Manufacturer/Model Number
HP, Dell, Gateway, Toshiba - 4 laptops and 2 desktops
OS
Vista, Windows7, Mint Mate, Zorin, Windows 8
CPU
from 1.6GHz Duo to i7
Monitor(s) Displays
2x HP w2207
Hard Drives
5x HDD, 7x SSD, 12x Externals
Keyboard
with trackball - no mices
Mouse
Trackball mice
Internet Speed
DSL 6000
The solution is simple - even over a year later. just reboot and the 'modified' will shrink.
That's treating the symptom, but it doesn't eliminate the cause of the excessive memory load. My system has 16GB of RAM. It would slowly fill up completely over a few days until Windows started closing down applications. I would then reboot the pc and the whole cycle started again. Now, after what i did yesterday, task manager shows a nice and stable 3.2GB load. Problem solved.
 

My Computer

Computer type
PC/Desktop
OS
Windows 7 Professional 64bit
I am not sure I remember correctly, but I think I solved the issue by letting Windows automatically manage my Virtual Memory.

As I mentioned in my first post, I used to have a manually configured paging file of 2000MB (initial) to 8000MB (maximum). Apparently, this was too low to handle my 32Gb of RAM (for reasons I don't fully understand). The reason I had such configuration was that I noticed a very low available disk space on my small C: SSD and after installing SequoiaView, I saw a huge pagefile.sys file in my C: drive (as well as a huge hiberfil.sys but that's another story). In order to prevent Windows to reserve such a huge chunk of my little SSD disk space, I manually set the Virtual Memory to the above values.

Currently, I have checked the "Automatically manage paging file size for all drives" in the Virtual Memory tab and I have no issues. I also no longer see any pagefile.sys file in any of my drives. I am not sure why that is, but I would guess that a fixed pagefile.sys is only created when the "Automatically manage paging file size for all drives" is not checked.

However, the Handles column suggested by Bonez0r is still interesting as you can see in my screenshot below. My top 2 consumers are related to Realtek software and after a little research on the internet, it seems they are well known for memory leaking.

I am still not sure why my Modified Memory is low (only 63MB with 9 days uptime) since there are still processes leaking memory. Maybe Windows can tackle these issues when they have the freedom to manage paging file themselves.
 

Attachments

  • Task_manager_Handles.jpg
    Task_manager_Handles.jpg
    62.5 KB · Views: 15

My Computer

Computer type
PC/Desktop
OS
Windows 7 64bit
CPU
Intel Core i7 3770K
Motherboard
Asrock OC Formula
Memory
G.Skill 32GB @2133
Graphics Card(s)
MSI N460GTX
Hard Drives
1x SSD OCZ Vertex 3 120GB
1x Seagate 500GB
2x Western Digital Red 2TB
1x Western Digital Red 4TB
Antivirus
Malwarebytes
Browser
Chrome
My simple methods that I use.

1. Let Windows 7 manage all memory.

2. I turn off Sleep and Hibernation. I don't use them. As fast as today's computers boot why bother.

3. When the computer is not in use; I turn if off. (Shut it down) (Give it a rest) Be nice to your little friend.
 

My Computer

Computer type
PC/Desktop
Computer Manufacturer/Model Number
Home made Desktop
OS
Windows 10 Pro. 64/ version 1709 Windows 7 Pro/64
CPU
Intel i7-6800K @ 4.3
Motherboard
ASUS X-99 Deluxe II
Memory
Corsair Platinum 16 gig @2400
Graphics Card(s)
EVGA GTX 1070 OC
Monitor(s) Displays
Asus 27" LED LCD/VE278Q
Screen Resolution
1920-1080 or 1280-720 HDMI
Hard Drives
INTEL SSD 730-240 Gb Sata 3.0/
PSU
EVGA Platium 1200W
Case
Phanteks Luxe Tempered Glass 8 fans/ one radiator
Cooling
XSPC/ Water Cooled CPU
Keyboard
Das 4 Professional
Mouse
Logitech M705/MX Anywhere 2-S
Internet Speed
100 mbits
Antivirus
Microsoft Security Essentials/ Malwarebytes Premium 3.0/ SAS
Browser
I.E. 11 default/Firefox/ ISP Time Warner Cable/Spectrum
Other Info
LG BluRay Burner/
Sound system-KLipsch-THX/
Icy Dock ssd Hot Swap bays.
Back
Top