- Local time
- 3:04 PM
- Messages
- 1,401
As some of you might know, I only recently started analyzing dump files and contributing to the BSoD Help and Support subforum. In the past two or three months that I've been busy with this I have received more support from BSoD Team members than I could ever have hoped for.
So I want to give something back; to SevenForums, the BSoD Team and most important, to people who want to begin with analyzing dump files, because I know all to well how hard it can be")
As the title says, you'll first need to download and install WinDBG on your machine, so that you have a program to open and interpret the dump files. So let's install it:
You can download the latest version of WinDBG here (currently 8.1).
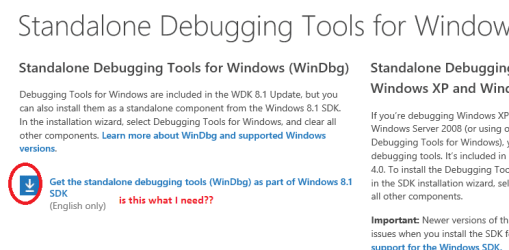
Note that there are three downloads on that site, WDK, SDK and a stand alone set.
WDK means Windows Driver Kit.
SDK means Software Development Kit.
All of these downloads contain WinDBG, but we will download the SDK by clicking on get the Windows SDK here.
After going to the download page, click on the download link as displayed on the image below;

After downloading the file and running it, you will see a screen where you can select the features that you want to download, uncheck everything other than WinDBG.

Now that you've downloaded WinDBG you'll need to install .NET Framework 4.5.2 before installing WinDBG.
You can download .NET Framework 4.5.2 here.
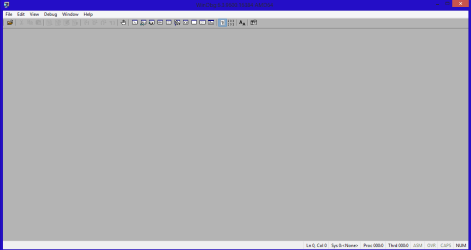
After downloading and installing .NET Framework 4.5.2 please restart your machine and then run the installer for WinDBG. Follow the onscreen instructions to install it.
After installing WinDBG and running it, you'll need to "install" a file path so that WinDBG can read the symbols in the dump files.
To do this, please open WinDBG, click on File and then click on Symbol File Path ....
Now please paste the following in the text box;
SRV*c:\symbols*http://msdl.microsoft.com/download/symbols
Now click on OK and close WinDBG. It will ask you if you want to save your workspace, accept it so what WinDBG will remember the symbol file path and click on Don't ask again so that you'll never need to do it again.

Congrats, you now have a fully functional version of WinDBG installed on your system!
:ar: Option one.
Now that you have WinDBG installed on your system, you'll want to know how to open and read dump files, so allow me to explain it.
First open WinDBG and then click on File. Now click on Open Crash Dump.

Now a new window will open, in which you need to navigate to the desired dump file that you want to open.
:ar: Option two.
Alternatively, you can associate dump files with WinDBG so that whenever you double click a dump file, it will automatically be opened with WinDBG.
To do this, open an Elevated Command Prompt and paste the following;
"C:\Program Files (x86)\Windows Kits\8.0\Debuggers\x64\windbg.exe" -IA
To paste something in CMD, click on the CMD icon in the upper left corner, then click on Edit and then on Paste. Now hit enter.
As said in the title, I will only go over the most basic functions here, as there are plenty of tutorials/blogs out there which explain the more advanced functions.
Once you've opened a dump file, it will look like this;
:ar: This is a dump file generated by my own machine.
A lot of text isn't it?
My first and most important advice here is don't panic! It might seen like a lot of gibberish at first sight, but once I've explained it a bit you'll see that it isn't all that bad
The first part, everything above "BugCheck Analysis", you can ignore for now.
Basically you'll see three things in this analysis;
1. "Use !analyze -v to get detailed debugging information."
!analyze -v is a command which you can use to, for instance, obtain the stack trace of the dump file, I will explain this command and the stack trace later on.
2. "BugCheck FC, {fffff8a009000100, 8400000165cf5121, fffff8800655f600, 2}"
This is the error, or as it is officially called, the stop code.
Most stop codes can be found at the MSDN site, which is here. What I do and what I recommend you to do too is to simply put the bugcheck code in Google. 9 out of 10 times the first link will be the specific MSDN page.
If we look at this stop code, we see that it refers to this MSDN page.
3. "*** WARNING: Unable to verify timestamp for asmtxhci.sys
*** ERROR: Module load completed but symbols could not be loaded for asmtxhci.sys
Probably caused by : asmtxhci.sys ( asmtxhci+1edcf )"
A lot of words, but basically all that's said is "hey, asmtxhci.sys is the failing driver, take a look there!".
Now your next step is to figure out what on earth that driver does. To do this we have the something called the Driver Reference Table.
You can find it here.
If we search for the failing driver from my dump file there, we'll be directed to this page.
Now let's use the !analyze -v command to see what we get;
Hrm, even more text. Again, don't panic! Relax, take a breath and sit back.
Everything above the "Debugging details" isn't of use to us; it's the exact same info that is displayed on the MSDN website we just checked.
Basically all you need to check here for now is the stack trace, or as it is called in WinDBG, the STACK_TEXT;
Firstly, the stack trace is to be read from bottom to top. Right now this will be of very little use to you, as you most likely don't have a clue what stack traces are and what they're good for, but now you know it anyway
That said, I will not explain what stack traces are or anything related, as there are plenty of tutorials out there that do this.
Basically all that you, as beginning crash dump analyst, need to do here, is look for something that resembles a driver name.
As we have seen in the previous step, asmtxhci.sys is the failing driver, and when we look at the fifth line, we see "asmtxhci+0x1edcf".
There you have it, the failing driver.
This command will display more detailed information about one specific driver. Let's use it on asmtxhci.sys to see what we get;
Let's start at the beginning.
To use this command you'll need to type lmvm <failing driver name>.
As we see in my example looking at the "timestamp", we see that the driver installed dates back to 2011, this is very old. My advice is that every driver that dates before December 2012 or January 2013 should be updated.
To check for updates, you can search for the driver name in the Driver Reference Table and then click on the link in the third column. 9 out of the 10 times this will take you to the download page of the driver.
If not, simply search for the driver name in Google.
Now there are plenty of other tutorials, blogs, websites and even entire online communities dedicated to debugging dump files, but this are the basics. Here are some useful links you can read as a beginning crash dump analyst;
Special thanks to the following members which all greatly supported me:
Arc, thanks for assisting me in numerous threads, offering support when I needed it and helping me start up with debugging.
Northernsoul55, thanks for helping me with some OP's which I couldn't figure out on my own.
Koolkat77, thanks for your tutorials which got me into debugging in the first place, they have been and still are very useful.
YoYo155, thanks for answering the questions I had and allowing me to follow your threads.
x BlueRobot, thanks for your blog and all of the useful links you have provided.
Hope that this will be helpful for someone
Nommy
So I want to give something back; to SevenForums, the BSoD Team and most important, to people who want to begin with analyzing dump files, because I know all to well how hard it can be
1.
Installing WinDBG
As the title says, you'll first need to download and install WinDBG on your machine, so that you have a program to open and interpret the dump files. So let's install it:
You can download the latest version of WinDBG here (currently 8.1).
Note that there are three downloads on that site, WDK, SDK and a stand alone set.
WDK means Windows Driver Kit.
SDK means Software Development Kit.
All of these downloads contain WinDBG, but we will download the SDK by clicking on get the Windows SDK here.
After going to the download page, click on the download link as displayed on the image below;
After downloading the file and running it, you will see a screen where you can select the features that you want to download, uncheck everything other than WinDBG.
Now that you've downloaded WinDBG you'll need to install .NET Framework 4.5.2 before installing WinDBG.
You can download .NET Framework 4.5.2 here.
After downloading and installing .NET Framework 4.5.2 please restart your machine and then run the installer for WinDBG. Follow the onscreen instructions to install it.
After installing WinDBG and running it, you'll need to "install" a file path so that WinDBG can read the symbols in the dump files.
To do this, please open WinDBG, click on File and then click on Symbol File Path ....
Now please paste the following in the text box;
SRV*c:\symbols*http://msdl.microsoft.com/download/symbols
Now click on OK and close WinDBG. It will ask you if you want to save your workspace, accept it so what WinDBG will remember the symbol file path and click on Don't ask again so that you'll never need to do it again.
Congrats, you now have a fully functional version of WinDBG installed on your system!
2.
Opening Dump Files
:ar: Option one.
Now that you have WinDBG installed on your system, you'll want to know how to open and read dump files, so allow me to explain it.
First open WinDBG and then click on File. Now click on Open Crash Dump.
Now a new window will open, in which you need to navigate to the desired dump file that you want to open.
:ar: Option two.
Alternatively, you can associate dump files with WinDBG so that whenever you double click a dump file, it will automatically be opened with WinDBG.
To do this, open an Elevated Command Prompt and paste the following;
"C:\Program Files (x86)\Windows Kits\8.0\Debuggers\x64\windbg.exe" -IA
To paste something in CMD, click on the CMD icon in the upper left corner, then click on Edit and then on Paste. Now hit enter.
Note
The location in the highlighted line depends on where you have installed WinDBG.
To find it's location type "winDBG" in the search bar, right click it and select Properties. Now copy the line next to Target and replace the highlighted location with that.
To find it's location type "winDBG" in the search bar, right click it and select Properties. Now copy the line next to Target and replace the highlighted location with that.
3.
Interpreting dump files
As said in the title, I will only go over the most basic functions here, as there are plenty of tutorials/blogs out there which explain the more advanced functions.
Once you've opened a dump file, it will look like this;
:ar: This is a dump file generated by my own machine.
Code:
Microsoft (R) Windows Debugger Version 6.2.9200.20512 AMD64
Copyright (c) Microsoft Corporation. All rights reserved.


Loading Dump File [C:\Users\Stefan\Desktop\ \SF_27-08-2013\082713-55505-01.dmp]
Mini Kernel Dump File: Only registers and stack trace are available

Symbol search path is: SRV*c:\symbols*http://msdl.microsoft.com/download/symbols
Executable search path is:
Windows 7 Kernel Version 7601 (Service Pack 1) MP (4 procs) Free x64
Product: WinNt, suite: TerminalServer SingleUserTS Personal
Built by: 7601.18205.amd64fre.win7sp1_gdr.130708-1532
Machine Name:
Kernel base = 0xfffff800`02e4d000 PsLoadedModuleList = 0xfffff800`030906d0
Debug session time: Mon Aug 26 23:24:31.039 2013 (UTC + 1:00)
System Uptime: 11 days 5:14:58.139
Loading Kernel Symbols
...............................................................
................................................................
...............................
Loading User Symbols
Loading unloaded module list
..................................................
*******************************************************************************
*                                                                             *
*                        Bugcheck Analysis                                    *
*                                                                             *
*******************************************************************************

Use !analyze -v to get detailed debugging information.

BugCheck FC, {fffff8a009000100, 8400000165cf5121, fffff8800655f600, 2}

*** WARNING: Unable to verify timestamp for asmtxhci.sys
*** ERROR: Module load completed but symbols could not be loaded for asmtxhci.sys
Probably caused by : asmtxhci.sys ( asmtxhci+1edcf )

Followup: MachineOwner
---------My first and most important advice here is don't panic! It might seen like a lot of gibberish at first sight, but once I've explained it a bit you'll see that it isn't all that bad
The first part, everything above "BugCheck Analysis", you can ignore for now.
Basically you'll see three things in this analysis;
1. "Use !analyze -v to get detailed debugging information."
!analyze -v is a command which you can use to, for instance, obtain the stack trace of the dump file, I will explain this command and the stack trace later on.
2. "BugCheck FC, {fffff8a009000100, 8400000165cf5121, fffff8800655f600, 2}"
This is the error, or as it is officially called, the stop code.
Most stop codes can be found at the MSDN site, which is here. What I do and what I recommend you to do too is to simply put the bugcheck code in Google. 9 out of 10 times the first link will be the specific MSDN page.
If we look at this stop code, we see that it refers to this MSDN page.
I will not further analyze this dump file or stop code, as that is not the goal of this thread.MSDN said:Bug Check 0xFC:
ATTEMPTED_EXECUTE_OF_NOEXECUTE_MEMORY
The ATTEMPTED_EXECUTE_OF_NOEXECUTE_MEMORY bug check has a value of 0x000000FC.
This indicates that an attempt was made to execute non-executable memory.
Source: Bug Check 0xFC: ATTEMPTED_EXECUTE_OF_NOEXECUTE_MEMORY (Windows Debuggers)
3. "*** WARNING: Unable to verify timestamp for asmtxhci.sys
*** ERROR: Module load completed but symbols could not be loaded for asmtxhci.sys
Probably caused by : asmtxhci.sys ( asmtxhci+1edcf )"
A lot of words, but basically all that's said is "hey, asmtxhci.sys is the failing driver, take a look there!".
Now your next step is to figure out what on earth that driver does. To do this we have the something called the Driver Reference Table.
You can find it here.
Information
Long list eh?
I bet that you don't want to look through it entirely just to find one pesky driver.
Well neither do I, do why don't we ease the search a bit
Simply hit Ctrl+F to open up the "Find in page" menu, and type/paste the driver name there.
I bet that you don't want to look through it entirely just to find one pesky driver.
Well neither do I, do why don't we ease the search a bit
Simply hit Ctrl+F to open up the "Find in page" menu, and type/paste the driver name there.
And there is your problem; the USB port driver was failing, and the link to update said driver is displayed under there.Carrona said:Driver Description: Asmedia USB 3.0 driver
Driver Update Site: ASMedia Technology Inc. ????
Source: Driver Reference Table - asmtxhci.sys
4.
!analyze -v
Now let's use the !analyze -v command to see what we get;
Code:
2: kd> !analyze -v
*******************************************************************************
*                                                                             *
*                        Bugcheck Analysis                                    *
*                                                                             *
*******************************************************************************

ATTEMPTED_EXECUTE_OF_NOEXECUTE_MEMORY (fc)
An attempt was made to execute non-executable memory.  The guilty driver
is on the stack trace (and is typically the current instruction pointer).
When possible, the guilty driver's name (Unicode string) is printed on
the bugcheck screen and saved in KiBugCheckDriver.
Arguments:
Arg1: fffff8a009000100, Virtual address for the attempted execute.
Arg2: 8400000165cf5121, PTE contents.
Arg3: fffff8800655f600, (reserved)
Arg4: 0000000000000002, (reserved)

Debugging Details:
------------------


CUSTOMER_CRASH_COUNT:  1

DEFAULT_BUCKET_ID:  WIN7_DRIVER_FAULT

BUGCHECK_STR:  0xFC

PROCESS_NAME:  System

CURRENT_IRQL:  0

TRAP_FRAME:  fffff8800655f600 -- (.trap 0xfffff8800655f600)
NOTE: The trap frame does not contain all registers.
Some register values may be zeroed or incorrect.
rax=fffff8a009000100 rbx=0000000000000000 rcx=fffffa80080ca570
rdx=000000008018e235 rsi=0000000000000000 rdi=0000000000000000
rip=fffff8a009000100 rsp=fffff8800655f798 rbp=fffff8800655f7f0
 r8=fffff8800655f7f0  r9=fffff8800655f7f0 r10=00000000fffffff7
r11=fffff8800655f980 r12=0000000000000000 r13=0000000000000000
r14=0000000000000000 r15=0000000000000000
iopl=0         nv up ei ng nz na po nc
fffff8a0`09000100 0035002c0020    add     byte ptr [fffff8a0`29002d06],dh ds:fffff8a0`29002d06=??
Resetting default scope

LAST_CONTROL_TRANSFER:  from fffff80002f408a8 to fffff80002ec2b80

STACK_TEXT:
fffff880`0655f498 fffff800`02f408a8 : 00000000`000000fc fffff8a0`09000100 84000001`65cf5121 fffff880`0655f600 : nt!KeBugCheckEx
fffff880`0655f4a0 fffff800`02ec0cae : 00000000`00000008 fffff8a0`09000100 00000000`00000000 fffffa80`080ca570 : nt! ?? ::FNODOBFM::`string'+0x44dfc
fffff880`0655f600 fffff8a0`09000100 : fffff880`088b2dcf 00000000`00000020 fffff800`02e9ce7a 00000000`00000002 : nt!KiPageFault+0x16e
fffff880`0655f798 fffff880`088b2dcf : 00000000`00000020 fffff800`02e9ce7a 00000000`00000002 00000000`00000000 : 0xfffff8a0`09000100
fffff880`0655f7a0 00000000`00000020 : fffff800`02e9ce7a 00000000`00000002 00000000`00000000 fffff800`03052728 : asmtxhci+0x1edcf
fffff880`0655f7a8 fffff800`02e9ce7a : 00000000`00000002 00000000`00000000 fffff800`03052728 fffff880`088aad6c : 0x20
fffff880`0655f7b0 00000000`00000001 : 00000000`00000005 00000000`00000000 fffffa80`080ca570 00000000`00000000 : nt!KeCancelTimer+0x1a
fffff880`0655f7e0 00000000`00000005 : 00000000`00000000 fffffa80`080ca570 00000000`00000000 00000000`00000000 : 0x1
fffff880`0655f7e8 00000000`00000000 : fffffa80`080ca570 00000000`00000000 00000000`00000000 fffff880`088b2f77 : 0x5


STACK_COMMAND:  kb

FOLLOWUP_IP:
asmtxhci+1edcf
fffff880`088b2dcf ??              ???

SYMBOL_STACK_INDEX:  4

SYMBOL_NAME:  asmtxhci+1edcf

FOLLOWUP_NAME:  MachineOwner

MODULE_NAME: asmtxhci

IMAGE_NAME:  asmtxhci.sys

DEBUG_FLR_IMAGE_TIMESTAMP:  4de6f522

FAILURE_BUCKET_ID:  X64_0xFC_asmtxhci+1edcf

BUCKET_ID:  X64_0xFC_asmtxhci+1edcf

Followup: MachineOwner
---------Everything above the "Debugging details" isn't of use to us; it's the exact same info that is displayed on the MSDN website we just checked.
Basically all you need to check here for now is the stack trace, or as it is called in WinDBG, the STACK_TEXT;
Code:
fffff880`0655f498 fffff800`02f408a8 : 00000000`000000fc fffff8a0`09000100 84000001`65cf5121 fffff880`0655f600 : nt!KeBugCheckEx
fffff880`0655f4a0 fffff800`02ec0cae : 00000000`00000008 fffff8a0`09000100 00000000`00000000 fffffa80`080ca570 : nt! ?? ::FNODOBFM::`string'+0x44dfc
fffff880`0655f600 fffff8a0`09000100 : fffff880`088b2dcf 00000000`00000020 fffff800`02e9ce7a 00000000`00000002 : nt!KiPageFault+0x16e
fffff880`0655f798 fffff880`088b2dcf : 00000000`00000020 fffff800`02e9ce7a 00000000`00000002 00000000`00000000 : 0xfffff8a0`09000100
fffff880`0655f7a0 00000000`00000020 : fffff800`02e9ce7a 00000000`00000002 00000000`00000000 fffff800`03052728 : asmtxhci+0x1edcf
fffff880`0655f7a8 fffff800`02e9ce7a : 00000000`00000002 00000000`00000000 fffff800`03052728 fffff880`088aad6c : 0x20
fffff880`0655f7b0 00000000`00000001 : 00000000`00000005 00000000`00000000 fffffa80`080ca570 00000000`00000000 : nt!KeCancelTimer+0x1a
fffff880`0655f7e0 00000000`00000005 : 00000000`00000000 fffffa80`080ca570 00000000`00000000 00000000`00000000 : 0x1
fffff880`0655f7e8 00000000`00000000 : fffffa80`080ca570 00000000`00000000 00000000`00000000 fffff880`088b2f77 : 0x5That said, I will not explain what stack traces are or anything related, as there are plenty of tutorials out there that do this.
Basically all that you, as beginning crash dump analyst, need to do here, is look for something that resembles a driver name.
As we have seen in the previous step, asmtxhci.sys is the failing driver, and when we look at the fifth line, we see "asmtxhci+0x1edcf".
There you have it, the failing driver.
5.
lmvm command
This command will display more detailed information about one specific driver. Let's use it on asmtxhci.sys to see what we get;
Code:
2: kd> lmvm asmtxhci
start             end                 module name
fffff880`08894000 fffff880`088f9000   asmtxhci T (no symbols)
    Loaded symbol image file: asmtxhci.sys
    Image path: \SystemRoot\system32\DRIVERS\asmtxhci.sys
    Image name: asmtxhci.sys
    Timestamp:        Thu Jun 02 04:27:46 2011 (4DE6F522)
    CheckSum:         0006BE1F
    ImageSize:        00065000
Translations: 0000.04b0 0000.04e4 0409.04b0 0409.04e4To use this command you'll need to type lmvm <failing driver name>.
As we see in my example looking at the "timestamp", we see that the driver installed dates back to 2011, this is very old. My advice is that every driver that dates before December 2012 or January 2013 should be updated.
To check for updates, you can search for the driver name in the Driver Reference Table and then click on the link in the third column. 9 out of the 10 times this will take you to the download page of the driver.
If not, simply search for the driver name in Google.
Note
Windows drivers or drivers that are in red in the Driver Reference Table don't need to be uploaded, as there most likely aren't any updates available.
Now there are plenty of other tutorials, blogs, websites and even entire online communities dedicated to debugging dump files, but this are the basics. Here are some useful links you can read as a beginning crash dump analyst;
- http://www.sevenforums.com/crash-lockup-debug-how/277355-debugging-bsod-my-way.html
- Windows Debuggers: Part 1: A WinDbg Tutorial - CodeProject
- www.carrona.org
- http://www.windbg.info/doc/1-common-cmds.html
- Analyze -v
- MSDN Blogs
- BSODTutorials
- Crash and lockup debug 'How To' - Windows 7 Help Forums
- http://www.sevenforums.com/crash-lo...utorials-information-links-2.html#post2585464
Special thanks to the following members which all greatly supported me:
Arc, thanks for assisting me in numerous threads, offering support when I needed it and helping me start up with debugging.
Northernsoul55, thanks for helping me with some OP's which I couldn't figure out on my own.
Koolkat77, thanks for your tutorials which got me into debugging in the first place, they have been and still are very useful.
YoYo155, thanks for answering the questions I had and allowing me to follow your threads.
x BlueRobot, thanks for your blog and all of the useful links you have provided.
Hope that this will be helpful for someone
Nommy
Last edited:
My Computer
At a glance
Microsoft Windows 8.1 64-bit ProfessionalIntel(R) Core(TM) i7-4510U CPU @ 2.00GHz8.00 GB (2 x 4.00 GB)AMD Radeon R7 M265
- Computer type
- Laptop
- Computer Manufacturer/Model Number
- Dell Inspiron 5547
- OS
- Microsoft Windows 8.1 64-bit Professional
- CPU
- Intel(R) Core(TM) i7-4510U CPU @ 2.00GHz
- Motherboard
- Dell Inc. 08KNCD
- Memory
- 8.00 GB (2 x 4.00 GB)
- Graphics Card(s)
- AMD Radeon R7 M265
- Screen Resolution
- 1366 x 768 x 4294967296 colors
- Hard Drives
- (1) 1TB ST1000LM024 HN-M101MBB (2) 2TB Western Digital external hard drive (3) 500GB Packard Bell external hard drive
- Mouse
- Corsair Vengeance M60
- Antivirus
- Windows Defender & Malwarebytes
- Browser
- Firefox, Chromium
- Other Info
- + Acer TravelMate 7730G with 32bit Ubuntu 14.04 LTS Trusty Tahr.

 !
!