


How to Open Resource Monitor in Windows 7 and Windows 8
InformationThis will show you how to open Resource Monitor to view information about the use of hardware (CPU, memory, disk, and network) and software (file handles and modules) resources from processes and services in real time in Windows 7 and Windows 8.
In addition to monitoring resource usage in real time, Resource Monitor can help you analyze unresponsive processes, identify which applications are using files, and control processes and services.NoteResource Monitor includes the following elements and features below.
Tabs
Resource Monitor includes five tabs: Overview, CPU, Memory, Disk, and Network. The Overview tab displays basic system resource usage information; the other tabs display information about each specific resource.
Tables
- Switch between tabs by clicking on the tab titles.
- If you have filtered results on one tab, only resources used by the selected processes or services will be displayed on the other tabs. Filtered results are denoted by an orange bar below the title bar of each table. To stop filtering results while viewing the current tab, in the key table, clear the check box next to Image.
Each tab in Resource Monitor includes multiple tables that provide detailed information about the resource featured on that tab.
Chart pane
- To expand or collapse a table, click the arrow on the right side of the title bar of the table. Not all tables are expanded by default.
- To add or hide data columns in a table, right-click any column label, and then click Select Columns. Select or clear the check boxes for the columns you want displayed. Not all columns are displayed by default.
- The first table displayed is always the key table, and it always contains a complete list of processes using the resource included on that tab. (The key table on the Overview tab contains a complete list of processes running on the system.)
- To sort table data, click the label of the column you want to sort by. To reverse the sort order, click the column label again.
- You can filter the detailed data in tables other than the key table by one or more processes or services. To filter, in the key table, select the check box next to each process or service you want to highlight. To stop filtering for a single process or service, clear its check box. To stop filtering altogether, in the key table, clear the check box next to Image.
- If you have filtered results, tables other than the key table will only display data for the selected processes or services.
- To view definitions of data displayed in the tables, move the mouse pointer over the column title you want more information about.
- A process that is no longer running, but that is included in the current displayed data, will appear as a gray entry in a table until the data expires.
Each tab in Resource Monitor includes a chart pane on the right side of the window that displays graphs of the resources included on that tab. Resource Monitor displays one graph for each logical processor and core.
- You can change the size of the graphs by clicking the Views button and selecting a different graph size of Large, Medium, or Small.
- You can hide the chart pane by clicking the arrow at the top of the pane.
- If you have filtered results, the resources used by the selected processes or services will be shown in the graphs as an orange line.
- If you have multiple logical processors, you can choose which ones are displayed in the chart pane. On the CPU tab, click Monitor, and then click Select Processors. In the Select Processors dialog box, clear the All CPUs check box, and then select the check boxes for the logical processors you want to display.
Here's How:
1. Do step 2 or 3 below for how you would like to open Resource Monitor.
2. Press the Windows + R keys to open the Run dialog, type resmon.exe, press Enter, and go to step 4 below.3. Open Task Manager (Ctrl+Shift_Esc), and click/tap on the Performance tab and Resource Monitor (Windows 7) or Open Resource Monitor (Windows 8), and go to step 4 below. (See screenshots below)That's it,
4. If prompted by UAC, then click/tap on Yes.
5. Overview Tab
6. CPU Tab
NOTE: Selecting processes will allow you to see all of the associated handles and modules for them.
7. Memory Tab
8. Disk Tab
9. Network Tab
Shawn
Related Tutorials
- How to Use Windows 7 Resource Monitor to View Handles and Modules
- How to See Services Running Under svchost.exe Process in Windows 7
- How to See Windows 7 Reliability and Problem History with Reliability Monitor
- How to Use Windows 7 Resource Monitor to Troubleshoot Unresponsive Applications
- How to Generate and View a System Health Report in Windows 8.1
- How to Generate and View a System Performance Report in Windows
Resource Monitor
-
New #1
 Excellent series of posts on numerous new options with the Windows 7 Resource Monitor. Your contributions to this site are invaluable !
-
-
New #3
Hey Brink, where is the "pagefile" usage you mentioned @ Monitor Page file in task manager / resource manager @ Resource Manager ?
-
New #4
Hello Sam,
I didn't mention it there. Only a link was added there.
You can see how much kernal memory is paged in Task Manager, but.....
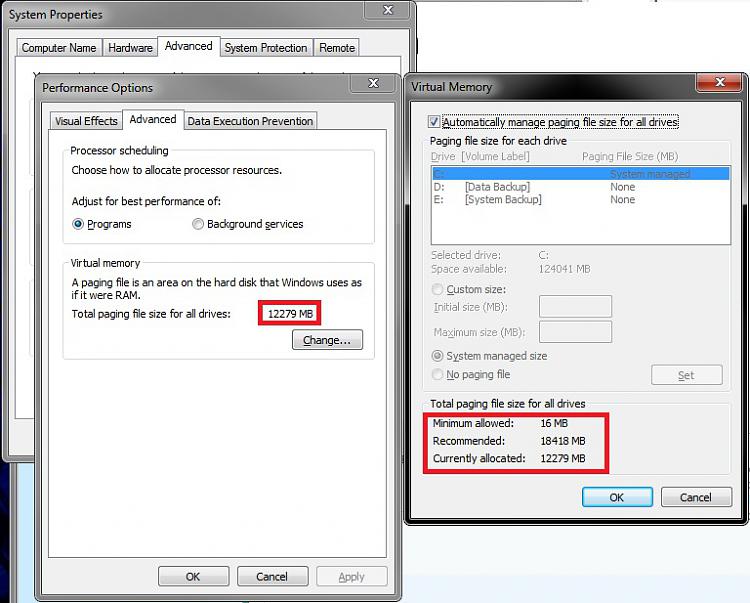
For the page file, it's best to see how much is being used in the Virtual Memory window instead.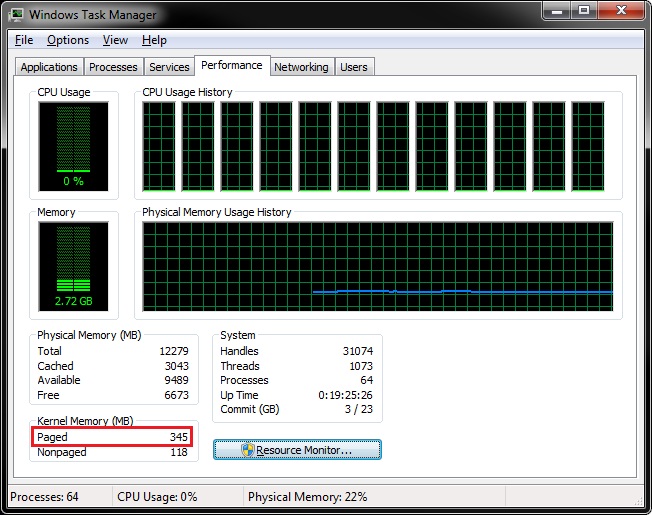
-
New #5
Thanks for replying Brink, but still I didn't want to know how to create/change pagefile. Is there anyway to see the actual pagefile usage in task/resource manager like in xp ?
Like of 2 GB pagefile 500 MB is currently paged/being used ... any ideas ? Thanks again.
-
New #6
Sam,
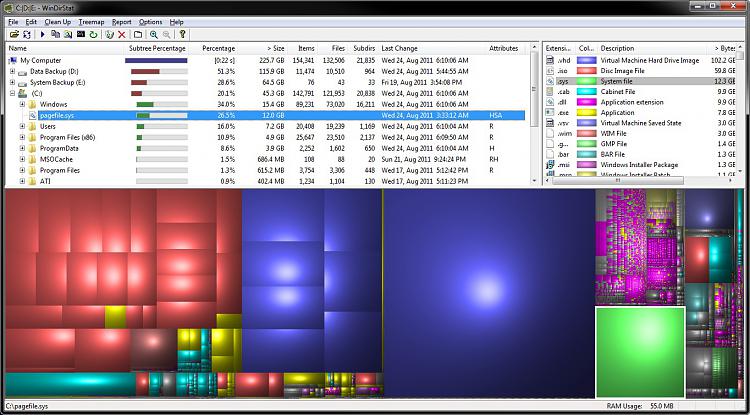
There's a great free program called WinDirStat that you can use to see the percentage used of the pagefile.
-
New #7
Thanks Brink! WinDirStat works perfectly :)
-
-
New #9
Thank You
Just wanted to add my cudos and thanks to Brinks for all the info and help. I find myself on this site whenever I encounter a problem with Windows 7 (so...all the time? haha) and really appreciate the help and guidance you offer! Concise, easy to understand and quick to reply - oh and screen shots, which are my salvation!
THANK YOU from the bottom of my semi-noob heart!


 Quote
Quote


Related Discussions