I am trying to do a simple line chart using Excel in Office 2007.
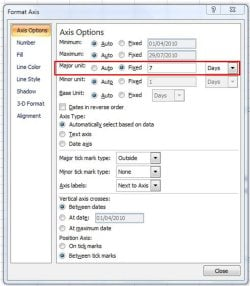
I have the dates in weekly order and two columns of prices, I want the chart to show the change in prices each week.
I select these three columns then go to Insert and select the first line chart shown.
It displays the price changes and the date format but by the month not the week.
In there anyway to get this data displayed weekly?
Thanks
jack
My Computer
- Computer Manufacturer/Model Number
- Packard Bell
- OS
- Windows 7 Home Premium
- CPU
- Intel(R) Core(TM2) Quad CPU Q8300 @ 2.50Mhz 4 Core(s)
- Motherboard
- Packard Bell EG43M
- Memory
- 6.00 GB
- Graphics Card(s)
- Geforce GT220
- Hard Drives
- 1.5 TB
- Keyboard
- Logitech Wireless
- Mouse
- Logitech Wireless
")