Help on Excel 10 graphics.

amflores

New member
Member
Local time
4:39 PM
Messages
97
Location
Rio de Janeiro, Brazil
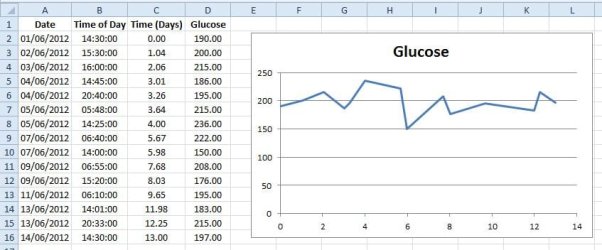
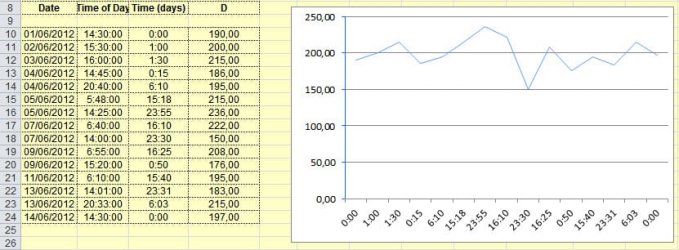
My doctor asked me to annotate (during one month time) dates and times of readings taken from my glycemic tests.
In some days, I have two or three readings at different times.
How can I display these three variables (date, time and readings) on my MS Office (Home & Business 32 bits) Excel 10 graphic? :o
Any help is welcome.
Flores
 

My Computer

Computer type
Laptop
Computer Manufacturer/Model Number
DELL Vostro 1510
OS
Windows 7 Home Premium 32bits
Hard Drives
Seagate external HD 500Gb
Browser
IE11 and Chrome
Other Info
DELL Vostro 1510
That is an interesting problem. You will need to use a 3D column chart. One axis (X, from left to right) should be the day, the next axis (depth, meaning front to back or "into" the screen) should be the time, and the 3rd axis (height) should be the glycemic reading.

The biggest problem will be orienting the chart so you can see all the readings. Taller ones in front will hide shorter ones in back but you can usually get around this with the proper rotation, although this will take some fussing. You can rotate the chart view in any direction so the proper orientation is going to depend on what your readings are like and how many in each day there are.
 

My Computer

Computer type
PC/Desktop
Computer Manufacturer/Model Number
Custom built
OS
Win7-64
CPU
Intel i7-3770S
Motherboard
ASUS P8Z77-M
Memory
16GB
Graphics Card(s)
nVidia GT630
Sound Card
onboard
Monitor(s) Displays
dual
Screen Resolution
1920x1200 (primary) 1050x1680 (secondary)
Hard Drives
128GB SSD (boot)
64GB SSD (Temp/My Documents)
500GB (photos/videos)
1TB (rendered video, backups)
PSU
650W
Case
Thermaltake A30
Cooling
Thermaltake
Keyboard
Logitech Lighted
Mouse
Kensington Expert Mouse (trackball)
Internet Speed
FIOS 35/35
Antivirus
MS Security Essentials
Browser
Chrome (beta)
You would only need three axes if you treat date and time of day as separate variables. I would instead treat time as a single variable. To do this, you'll need to use your dates and times of day to calculate a single figure representing time. The method below will give you time in days since the first reading, so the graph will start at time zero:

  1. Format the first column (Column A) as dates.
  2. Put the dates of the readings in that column.
  3. Format the second column (Column B) as times.
  4. Put the time of day (using the 24 hour clock) in that column.
  5. Format the third column, Column C, as numbers with two decimal places.
  6. Use this formula in the first cell in Column C:
    =(A1-$A$1)+(B1-$B$1)
  7. Drag the corner of the first cell down Column C until there is a value for every date/time pair.
  8. Put the blood glucose readings in Column D.
  9. Select Column C and Column D and insert the chart of your choice - I would suggest a 2D line.
  10. There you go :)

I have attached an Excel file that uses this method to draw a graph of glucose readings against time (using made-up data!).
 

Attachments

My Computer

Computer Manufacturer/Model Number
Custom
OS
Windows 7 Enterprise x64
CPU
Intel i7 920
Motherboard
Asus P6T Deluxe v2
Memory
6 GB
Graphics Card(s)
nVidia GTX260 + nVidia 3D
Sound Card
Onboard
Monitor(s) Displays
Samsung SyncMaster 2233RZ
Screen Resolution
1680 x 1050
Hard Drives
1 x 64GB SSD primary
2 x 1 TB (mirrored)
PSU
700W
Other Info
Edimax 802.11n Wireless PCI Card
Netgear DG834G router
.....The biggest problem will be orienting the chart so you can see all the readings.

Hello bbinnard,

Thanks for the help.
I will experiment adjusting the chart so all readings will be available for my doctor to see.

Cheers,
Flores
 

My Computer

Computer type
Laptop
Computer Manufacturer/Model Number
DELL Vostro 1510
OS
Windows 7 Home Premium 32bits
Hard Drives
Seagate external HD 500Gb
Browser
IE11 and Chrome
Other Info
DELL Vostro 1510
Hello clunkfish,

I'm having some difficulties adapting to the suggested method.
Give me some more time.
Thanks a lot.
Flores
 

My Computer

Computer type
Laptop
Computer Manufacturer/Model Number
DELL Vostro 1510
OS
Windows 7 Home Premium 32bits
Hard Drives
Seagate external HD 500Gb
Browser
IE11 and Chrome
Other Info
DELL Vostro 1510
Hi Flores - please do feel free to send me data and I will set up a spreadsheet for you, if that would help?
 

My Computer

Computer Manufacturer/Model Number
Custom
OS
Windows 7 Enterprise x64
CPU
Intel i7 920
Motherboard
Asus P6T Deluxe v2
Memory
6 GB
Graphics Card(s)
nVidia GTX260 + nVidia 3D
Sound Card
Onboard
Monitor(s) Displays
Samsung SyncMaster 2233RZ
Screen Resolution
1680 x 1050
Hard Drives
1 x 64GB SSD primary
2 x 1 TB (mirrored)
PSU
700W
Other Info
Edimax 802.11n Wireless PCI Card
Netgear DG834G router
..... - please do feel free to send me data and I will set up a spreadsheet for you, if that would help?

Hello clunkfish,

I'm quite sure I will need your further assistance.

Many thanks,
Flores
 

My Computer

Computer type
Laptop
Computer Manufacturer/Model Number
DELL Vostro 1510
OS
Windows 7 Home Premium 32bits
Hard Drives
Seagate external HD 500Gb
Browser
IE11 and Chrome
Other Info
DELL Vostro 1510
please do feel free to send me data and I will set up a spreadsheet for you.....

Hello clunkfish,

Attached please find the spreadsheet made in accordance with your instructions.

The problem is that the days are not showing up, only the times.

On some days I have more than one sample taken.

Regards,
Flores
Glucose.jpg
 

My Computer

Computer type
Laptop
Computer Manufacturer/Model Number
DELL Vostro 1510
OS
Windows 7 Home Premium 32bits
Hard Drives
Seagate external HD 500Gb
Browser
IE11 and Chrome
Other Info
DELL Vostro 1510
Hi Flores,

I think there must be a flaw in your formula. I have inserted your data in my worksheet and get the chart below, with the horizontal axis in days, as required:
 

Attachments

  • Glucose.jpg
    Glucose.jpg
    54.1 KB · Views: 3

My Computer

Computer Manufacturer/Model Number
Custom
OS
Windows 7 Enterprise x64
CPU
Intel i7 920
Motherboard
Asus P6T Deluxe v2
Memory
6 GB
Graphics Card(s)
nVidia GTX260 + nVidia 3D
Sound Card
Onboard
Monitor(s) Displays
Samsung SyncMaster 2233RZ
Screen Resolution
1680 x 1050
Hard Drives
1 x 64GB SSD primary
2 x 1 TB (mirrored)
PSU
700W
Other Info
Edimax 802.11n Wireless PCI Card
Netgear DG834G router
....I think there must be a flaw in your formula.


Hi, clunkfish,

Yes, the formula was wrong, but corrected now.
Still, column "Time(Days)" differs from yours.
Cheers,
Flores
 

Attachments

  • Glucose.jpg
    Glucose.jpg
    54.8 KB · Views: 4

My Computer

Computer type
Laptop
Computer Manufacturer/Model Number
DELL Vostro 1510
OS
Windows 7 Home Premium 32bits
Hard Drives
Seagate external HD 500Gb
Browser
IE11 and Chrome
Other Info
DELL Vostro 1510
Well, that's what I mean. The correct formula, as in the Excel spreadsheet I provided, will give the correct data, as in the image I uploaded. Because your Time(Days) column contains the wrong values, you must have the wrong formula...

If you just enter your data into the spreadsheet I provided, without changing any formats or formulas, it will work :)
 

My Computer

Computer Manufacturer/Model Number
Custom
OS
Windows 7 Enterprise x64
CPU
Intel i7 920
Motherboard
Asus P6T Deluxe v2
Memory
6 GB
Graphics Card(s)
nVidia GTX260 + nVidia 3D
Sound Card
Onboard
Monitor(s) Displays
Samsung SyncMaster 2233RZ
Screen Resolution
1680 x 1050
Hard Drives
1 x 64GB SSD primary
2 x 1 TB (mirrored)
PSU
700W
Other Info
Edimax 802.11n Wireless PCI Card
Netgear DG834G router
Hi clunkfish,

I think I'm missing something from your teachings.
Please, check the formulas and formats on my attached zip file.

Regards,
Flores
 

Attachments

My Computer

Computer type
Laptop
Computer Manufacturer/Model Number
DELL Vostro 1510
OS
Windows 7 Home Premium 32bits
Hard Drives
Seagate external HD 500Gb
Browser
IE11 and Chrome
Other Info
DELL Vostro 1510
Problem identified :)

Your Time(Days) column is formatted as time, when it needs to be formatted as number. If you highlight the cells, right-click, go to "Format Cells...", then choose "Number" from the list of categories, the values under Time(Days) will change to the correct ones.

You also need to change the chart type, so that the values on the horizontal axis are arranged correctly. Just right-click the chart, choose "Change Chart Type...", and select "X Y Scatter". I think I had that wrongly set up in the original spreadsheet ;)

Hope this helps you to make the chart you need.
 

My Computer

Computer Manufacturer/Model Number
Custom
OS
Windows 7 Enterprise x64
CPU
Intel i7 920
Motherboard
Asus P6T Deluxe v2
Memory
6 GB
Graphics Card(s)
nVidia GTX260 + nVidia 3D
Sound Card
Onboard
Monitor(s) Displays
Samsung SyncMaster 2233RZ
Screen Resolution
1680 x 1050
Hard Drives
1 x 64GB SSD primary
2 x 1 TB (mirrored)
PSU
700W
Other Info
Edimax 802.11n Wireless PCI Card
Netgear DG834G router
Back
Top