One other thought, for testing. Uninstall Realtek in the Device Manager (and the drivers). Then restart the PC and Windows will (should) install the generic High Definition Audio driver. See what happens with this driver, again for testing.
Okay I ran it for a while, seems it found some issues :| and it described exactly the issue I'm having, so that's good.
So what do I do next? the suggestions it gives arent something Im familiar with doing on windows.
And thanks mrjimphelps, I'll look into testing that if this current testing fails, cheers
(edit) oh and heres the report it gave me:
_________________________________________________________________________________________________________
CONCLUSION
_________________________________________________________________________________________________________
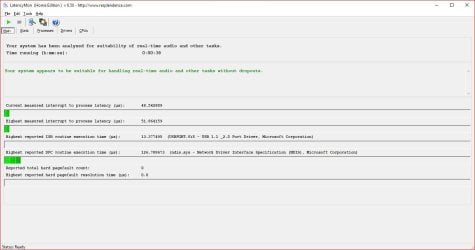
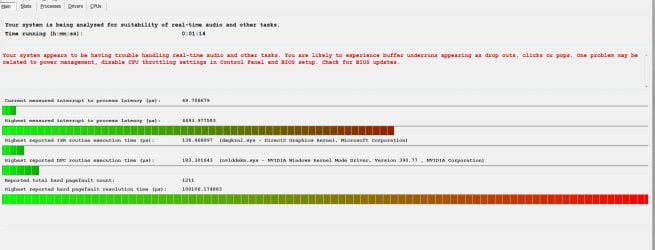
Your system appears to be having trouble handling real-time audio and other tasks. You are likely to experience buffer underruns appearing as drop outs, clicks or pops. One problem may be related to power management, disable CPU throttling settings in Control Panel and BIOS setup. Check for BIOS updates.
LatencyMon has been analyzing your system for 7:56:38 (h:mm:ss) on all processors.
_________________________________________________________________________________________________________
SYSTEM INFORMATION
_________________________________________________________________________________________________________
Computer name: GJ-PC
OS version: Windows 7 Service Pack 1, 6.1, build: 7601 (x64)
Hardware: ASRock, Z170 Extreme4
CPU: GenuineIntel Intel(R) Core(TM) i7-6700 CPU @ 3.40GHz
Logical processors: 8
Processor groups: 1
RAM: 32715 MB total
_________________________________________________________________________________________________________
CPU SPEED
_________________________________________________________________________________________________________
Reported CPU speed: 3408 MHz
Measured CPU speed: 1 MHz (approx.)
Note: reported execution times may be calculated based on a fixed reported CPU speed. Disable variable speed settings like Intel Speed Step and AMD Cool N Quiet in the BIOS setup for more accurate results.
WARNING: the CPU speed that was measured is only a fraction of the CPU speed reported. Your CPUs may be throttled back due to variable speed settings and thermal issues. It is suggested that you run a utility which reports your actual CPU frequency and temperature.
_________________________________________________________________________________________________________
MEASURED INTERRUPT TO USER PROCESS LATENCIES
_________________________________________________________________________________________________________
The interrupt to process latency reflects the measured interval that a usermode process needed to respond to a hardware request from the moment the interrupt service routine started execution. This includes the scheduling and execution of a DPC routine, the signaling of an event and the waking up of a usermode thread from an idle wait state in response to that event.
Highest measured interrupt to process latency (µs): 20974.871198
Average measured interrupt to process latency (µs): 2.809035
Highest measured interrupt to DPC latency (µs): 5746.696461
Average measured interrupt to DPC latency (µs): 0.757167
_________________________________________________________________________________________________________
REPORTED ISRs
_________________________________________________________________________________________________________
Interrupt service routines are routines installed by the OS and device drivers that execute in response to a hardware interrupt signal.
Highest ISR routine execution time (µs): 245.477113
Driver with highest ISR routine execution time: dxgkrnl.sys - DirectX Graphics Kernel, Microsoft Corporation
Highest reported total ISR routine time (%): 0.087461
Driver with highest ISR total time: dxgkrnl.sys - DirectX Graphics Kernel, Microsoft Corporation
Total time spent in ISRs (%) 0.100976
ISR count (execution time <250 µs): 33030943
ISR count (execution time 250-500 µs): 0
ISR count (execution time 500-999 µs): 0
ISR count (execution time 1000-1999 µs): 0
ISR count (execution time 2000-3999 µs): 0
ISR count (execution time >=4000 µs): 0
_________________________________________________________________________________________________________
REPORTED DPCs
_________________________________________________________________________________________________________
DPC routines are part of the interrupt servicing dispatch mechanism and disable the possibility for a process to utilize the CPU while it is interrupted until the DPC has finished execution.
Highest DPC routine execution time (µs): 344.558099
Driver with highest DPC routine execution time: tcpip.sys - TCP/IP Driver, Microsoft Corporation
Highest reported total DPC routine time (%): 0.053287
Driver with highest DPC total execution time: iusb3xhc.sys - Intel(R) USB 3.0 eXtensible Host Controller Driver, Intel Corporation
Total time spent in DPCs (%) 0.152404
DPC count (execution time <250 µs): 143351025
DPC count (execution time 250-500 µs): 0
DPC count (execution time 500-999 µs): 56
DPC count (execution time 1000-1999 µs): 0
DPC count (execution time 2000-3999 µs): 0
DPC count (execution time >=4000 µs): 0
_________________________________________________________________________________________________________
REPORTED HARD PAGEFAULTS
_________________________________________________________________________________________________________
Hard pagefaults are events that get triggered by making use of virtual memory that is not resident in RAM but backed by a memory mapped file on disk. The process of resolving the hard pagefault requires reading in the memory from disk while the process is interrupted and blocked from execution.
NOTE: some processes were hit by hard pagefaults. If these were programs producing audio, they are likely to interrupt the audio stream resulting in dropouts, clicks and pops. Check the Processes tab to see which programs were hit.
Process with highest pagefault count: chrome.exe
Total number of hard pagefaults 69531
Hard pagefault count of hardest hit process: 29009
Highest hard pagefault resolution time (µs): 1008762.292840
Total time spent in hard pagefaults (%): 0.063749
Number of processes hit: 67
_________________________________________________________________________________________________________
PER CPU DATA
_________________________________________________________________________________________________________
CPU 0 Interrupt cycle time (s): 1244.068981
CPU 0 ISR highest execution time (µs): 245.477113
CPU 0 ISR total execution time (s): 231.018303
CPU 0 ISR count: 33030943
CPU 0 DPC highest execution time (µs): 307.274648
CPU 0 DPC total execution time (s): 330.280332
CPU 0 DPC count: 137187184
_________________________________________________________________________________________________________
CPU 1 Interrupt cycle time (s): 583.711232
CPU 1 ISR highest execution time (µs): 0.0
CPU 1 ISR total execution time (s): 0.0
CPU 1 ISR count: 0
CPU 1 DPC highest execution time (µs): 253.237676
CPU 1 DPC total execution time (s): 1.947490
CPU 1 DPC count: 640085
_________________________________________________________________________________________________________
CPU 2 Interrupt cycle time (s): 276.701443
CPU 2 ISR highest execution time (µs): 0.0
CPU 2 ISR total execution time (s): 0.0
CPU 2 ISR count: 0
CPU 2 DPC highest execution time (µs): 228.330399
CPU 2 DPC total execution time (s): 2.566825
CPU 2 DPC count: 994198
_________________________________________________________________________________________________________
CPU 3 Interrupt cycle time (s): 728.668220
CPU 3 ISR highest execution time (µs): 0.0
CPU 3 ISR total execution time (s): 0.0
CPU 3 ISR count: 0
CPU 3 DPC highest execution time (µs): 298.473005
CPU 3 DPC total execution time (s): 1.276198
CPU 3 DPC count: 433105
_________________________________________________________________________________________________________
CPU 4 Interrupt cycle time (s): 603.993392
CPU 4 ISR highest execution time (µs): 0.0
CPU 4 ISR total execution time (s): 0.0
CPU 4 ISR count: 0
CPU 4 DPC highest execution time (µs): 297.394366
CPU 4 DPC total execution time (s): 4.021379
CPU 4 DPC count: 1336031
_________________________________________________________________________________________________________
CPU 5 Interrupt cycle time (s): 566.326903
CPU 5 ISR highest execution time (µs): 0.0
CPU 5 ISR total execution time (s): 0.0
CPU 5 ISR count: 0
CPU 5 DPC highest execution time (µs): 344.558099
CPU 5 DPC total execution time (s): 1.098345
CPU 5 DPC count: 285292
_________________________________________________________________________________________________________
CPU 6 Interrupt cycle time (s): 479.584232
CPU 6 ISR highest execution time (µs): 0.0
CPU 6 ISR total execution time (s): 0.0
CPU 6 ISR count: 0
CPU 6 DPC highest execution time (µs): 219.146127
CPU 6 DPC total execution time (s): 5.194454
CPU 6 DPC count: 1549801
_________________________________________________________________________________________________________
CPU 7 Interrupt cycle time (s): 477.691150
CPU 7 ISR highest execution time (µs): 0.0
CPU 7 ISR total execution time (s): 0.0
CPU 7 ISR count: 0
CPU 7 DPC highest execution time (µs): 211.685446
CPU 7 DPC total execution time (s): 2.292005
CPU 7 DPC count: 925385
_________________________________________________________________________________________________________