H2SO4, I cant tell you that

it is a complex story and mechanism.
Awww
Being thus forced to rely on my own inadequate understanding if I was going to learn more about this "memory optimisation" business, I took the liberty of downloading the trial version of Win7Zilla and having a little look.
After kicking off a Perfmon log, I attached a lil old utility called a "debugger" (I read about it in MSDN) to the Win7zilla process. On a hunch, I set a breakpoint on kernel32!VirtualAlloc before invoking Win7zilla's "extreme optimisation" routine:
Code:
Breakpoint 0 hit
KERNEL32!VirtualAlloc:
76fa1553 8bff            mov     edi,edi
0:005:x86> kv
*** ERROR: Module load completed but symbols could not be loaded for C:\Win7Zilla\install\bin\Win7Zilla.exe
ChildEBP RetAddr  Args to Child
WARNING: Stack unwind information not available. Following frames may be wrong.
0344febc 00503401 00000000 00400000 00003000 KERNEL32!VirtualAlloc
0344ff60 005082e5 00000032 4ab64696 00000000 Win7Zilla+0x103401
0344ff88 76fa3f39 02cc2158 0344ffd4 77920409 Win7Zilla+0x1082e5
*** ERROR: Symbol file could not be found.  Defaulted to export symbols for ntdll.dll -
0344ff94 77920409 02cc2158 3770f085 00000000 KERNEL32!BaseThreadInitThunk+0x12
0344ffd4 779203dc 00508250 02cc2158 00000000 ntdll_778d0000!RtlInitializeExceptionChain+0x63
0344ffec 00000000 00508250 02cc2158 00000000 ntdll_778d0000!RtlInitializeExceptionChain+0x36
0:005:x86> ? 400000
Evaluate expression: 4194304 = 00400000
0:005:x86> ? 3000
Evaluate expression: 12288 = 00003000
0:005:x86> * first arg = 0 = don't care where in memory
0:005:x86> * second arg = 4MB chunk = requested alloc size
0:005:x86> * third arg = 0x3000 = MEM_RESERVE | MEM_COMMIT
So Win7zilla's "extreme optimiser" had just requested 4MB of MEM_RESERVE|MEM_COMMIT memory anywhere inside it's own VM space. Fascinating
By now, I was suspecting it may do that a few more times, so I set up a pseudo-register to keep track of the Win7zilla VirtualAlloc running total:
Code:
breakpoint 0 redefined
0:005:x86> bu KERNEL32!VirtualAlloc ".echo ====== Another VirtualAlloc() call =========; kb5; r$t1 = $t1 + (esp+8); g"
breakpoint 0 redefined
Amazingly, Win7zilla then called VirtualAlloc >120 times more! The total amount requested by the time the "optimisation" fest was over topped 500MB.
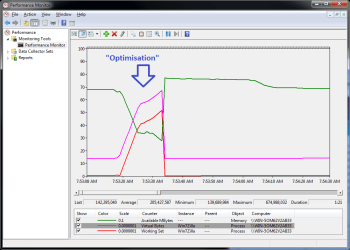
The attached perfmon log clearly shows the Win7zilla process swelling up in memory, only to immediately release it all again. The only effect is to make the OS trim the working sets of all other (real) processes to make room for the Win7zilla "puffer fish" act. Of course, that just slows down the real apps because their memory has been pushed out to disk to make room for Win7zilla. It's the garden variety cheap 'n' nasty "memory optimiser" reporting trick. It
looks like there's more memory available when the "optimiser" is finished, but that's because it has forced out the real apps to make an empty hole.
Over time, the OS will read back into RAM the real app stuff you caused to be paged out to disk, but until then the hapless user of your "optimiser" will suffer somewhat degraded performance.
Do you have anything to say to put a positive spin on all this?